Chasing Pole Position: Qualifying Pace Predictor
Data Preprocessing
To predict the best qualifying lap times for each driver across a race weekend, data from all Formula 1 races between the 2022 and 2025 seasons was collected using the FastF1 API. A range of features influencing qualifying lap times was selected, including:
- Event Metadata: Year, Round, Circuit Type
- Driver Factors: Driver, Team, Tyre Compound, Tyre Life, Fresh Tyre status
- Weather: Air Temperature, Humidity, Pressure, Rainfall, Wind Speed, Wind Direction
- Performance Metrics: Sector 1/2/3 times, FP2 lap times, FP2 gap to best lap
Feature Engineering
- Categorical features (Driver, Team, Tyre Compound) → One‑Hot Encoding
- Numerical features (Weather, Tyre Life, Sector Times) → z‑score normalization
- Resolved team‑name rebrands (e.g. “Alfa Romeo” → “Stake”) for consistency
ML Algorithms / Models Implemented
To model qualifying lap times as a regression problem, we implemented the following machine learning algorithms:
- Linear Regression
- Lasso Regression
- Ridge Regression
- Support Vector Regression
- Random Forest Regression
- Gradient Boosting Regression
To ensure the models generalize well and avoid overfitting, we employed 5-fold cross-validation using GridSearchCV for hyperparameter tuning and performance evaluation.
Visualizations
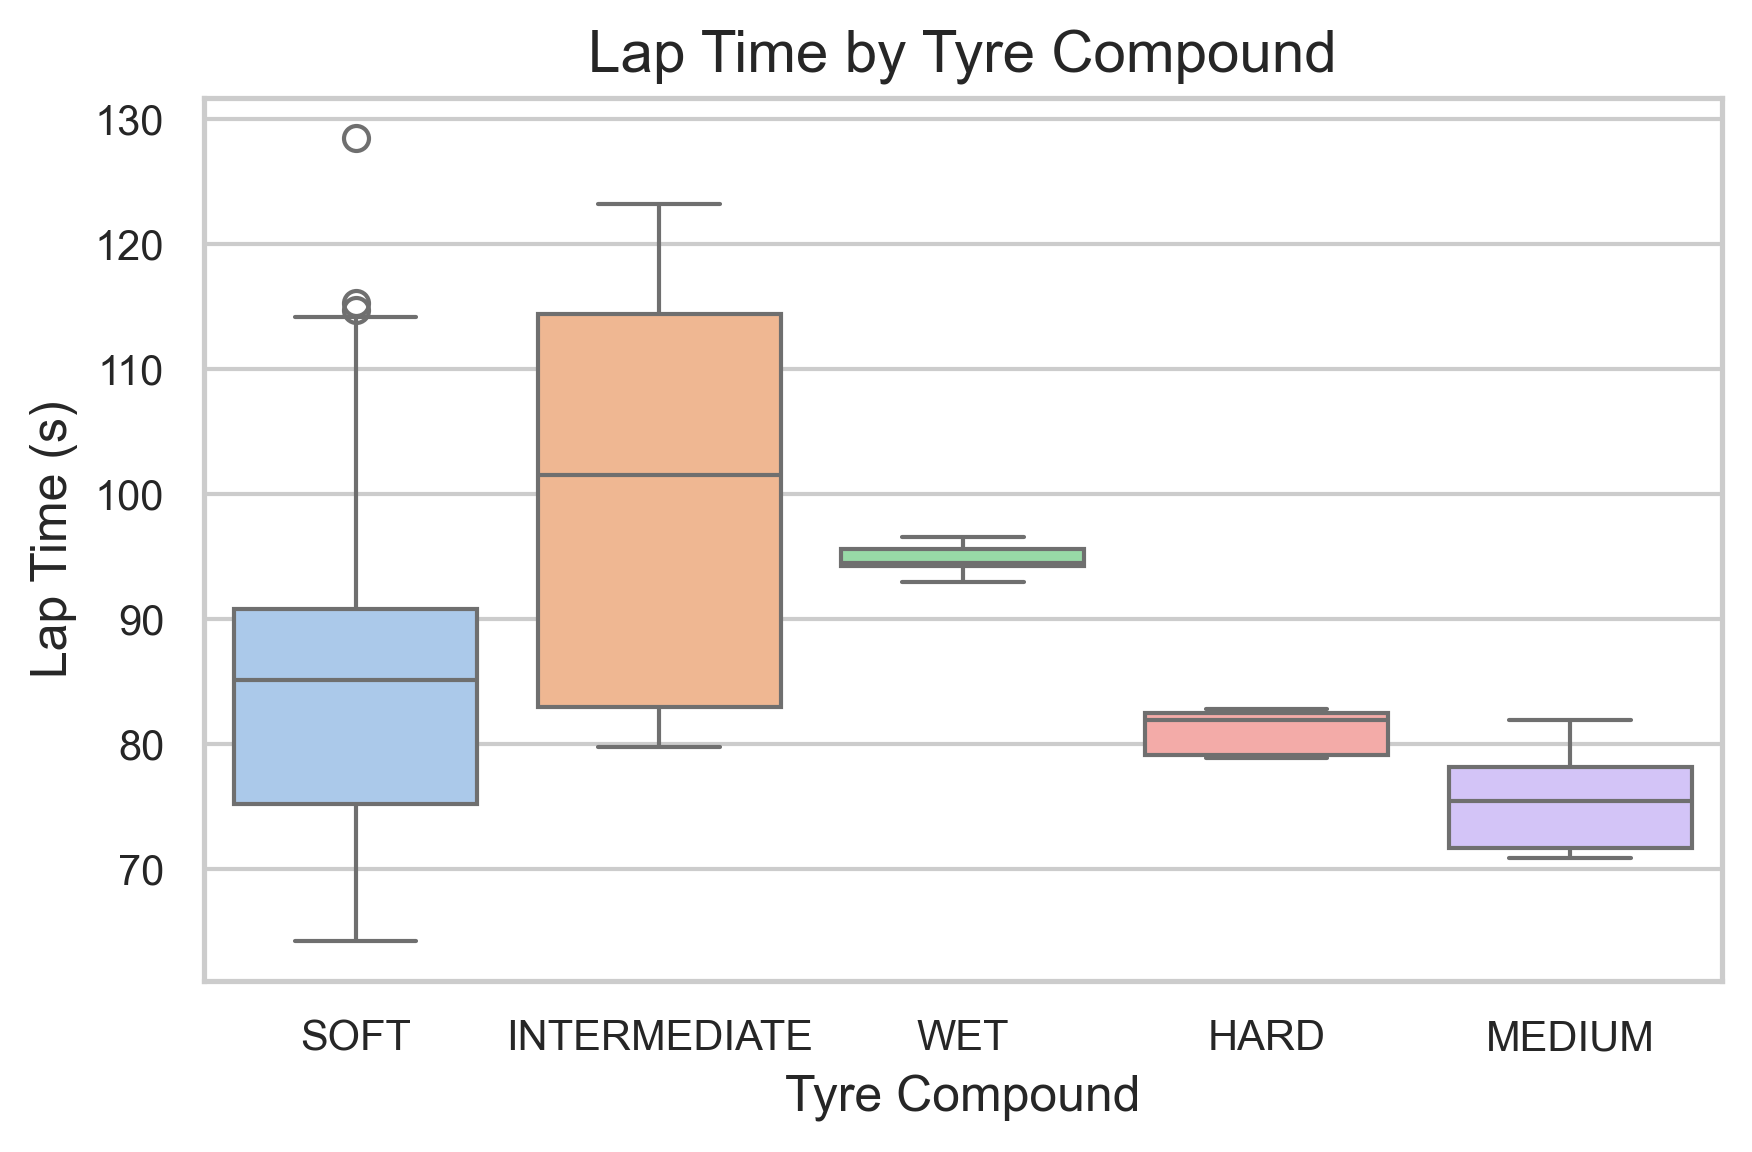
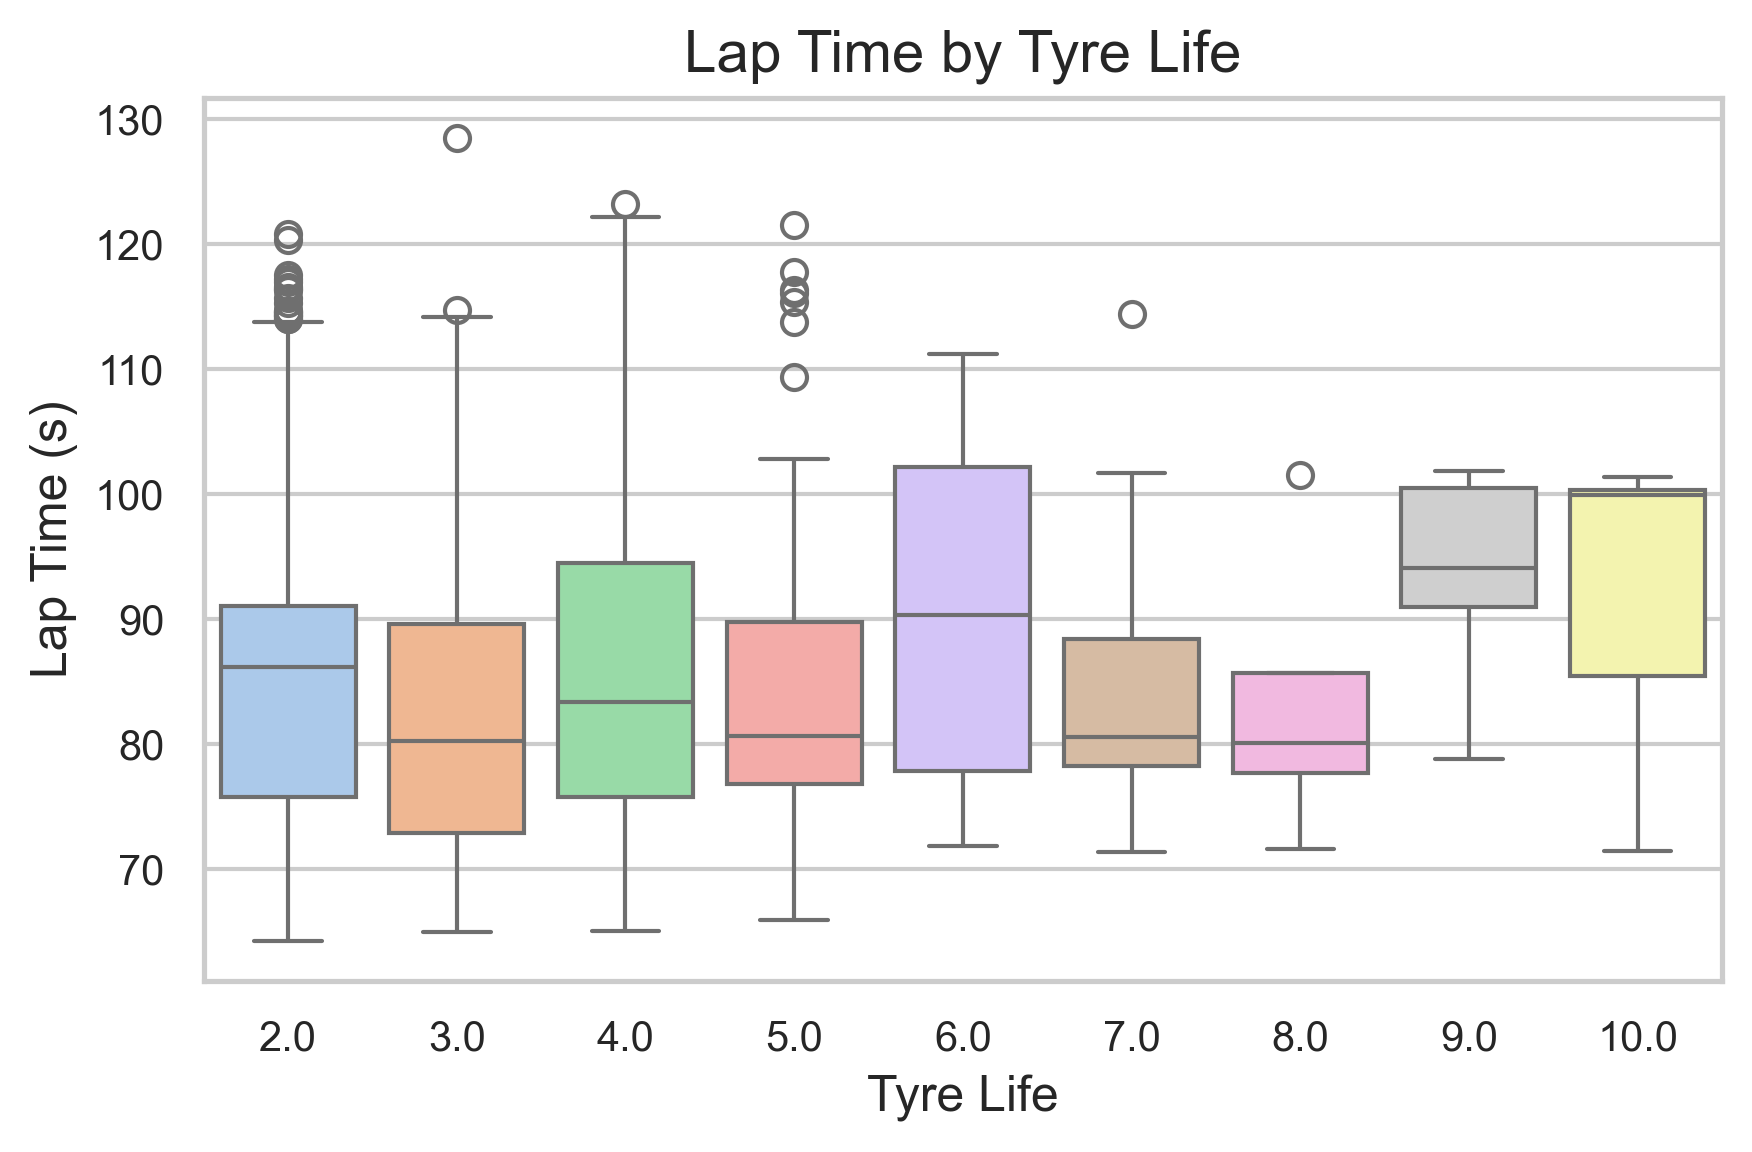
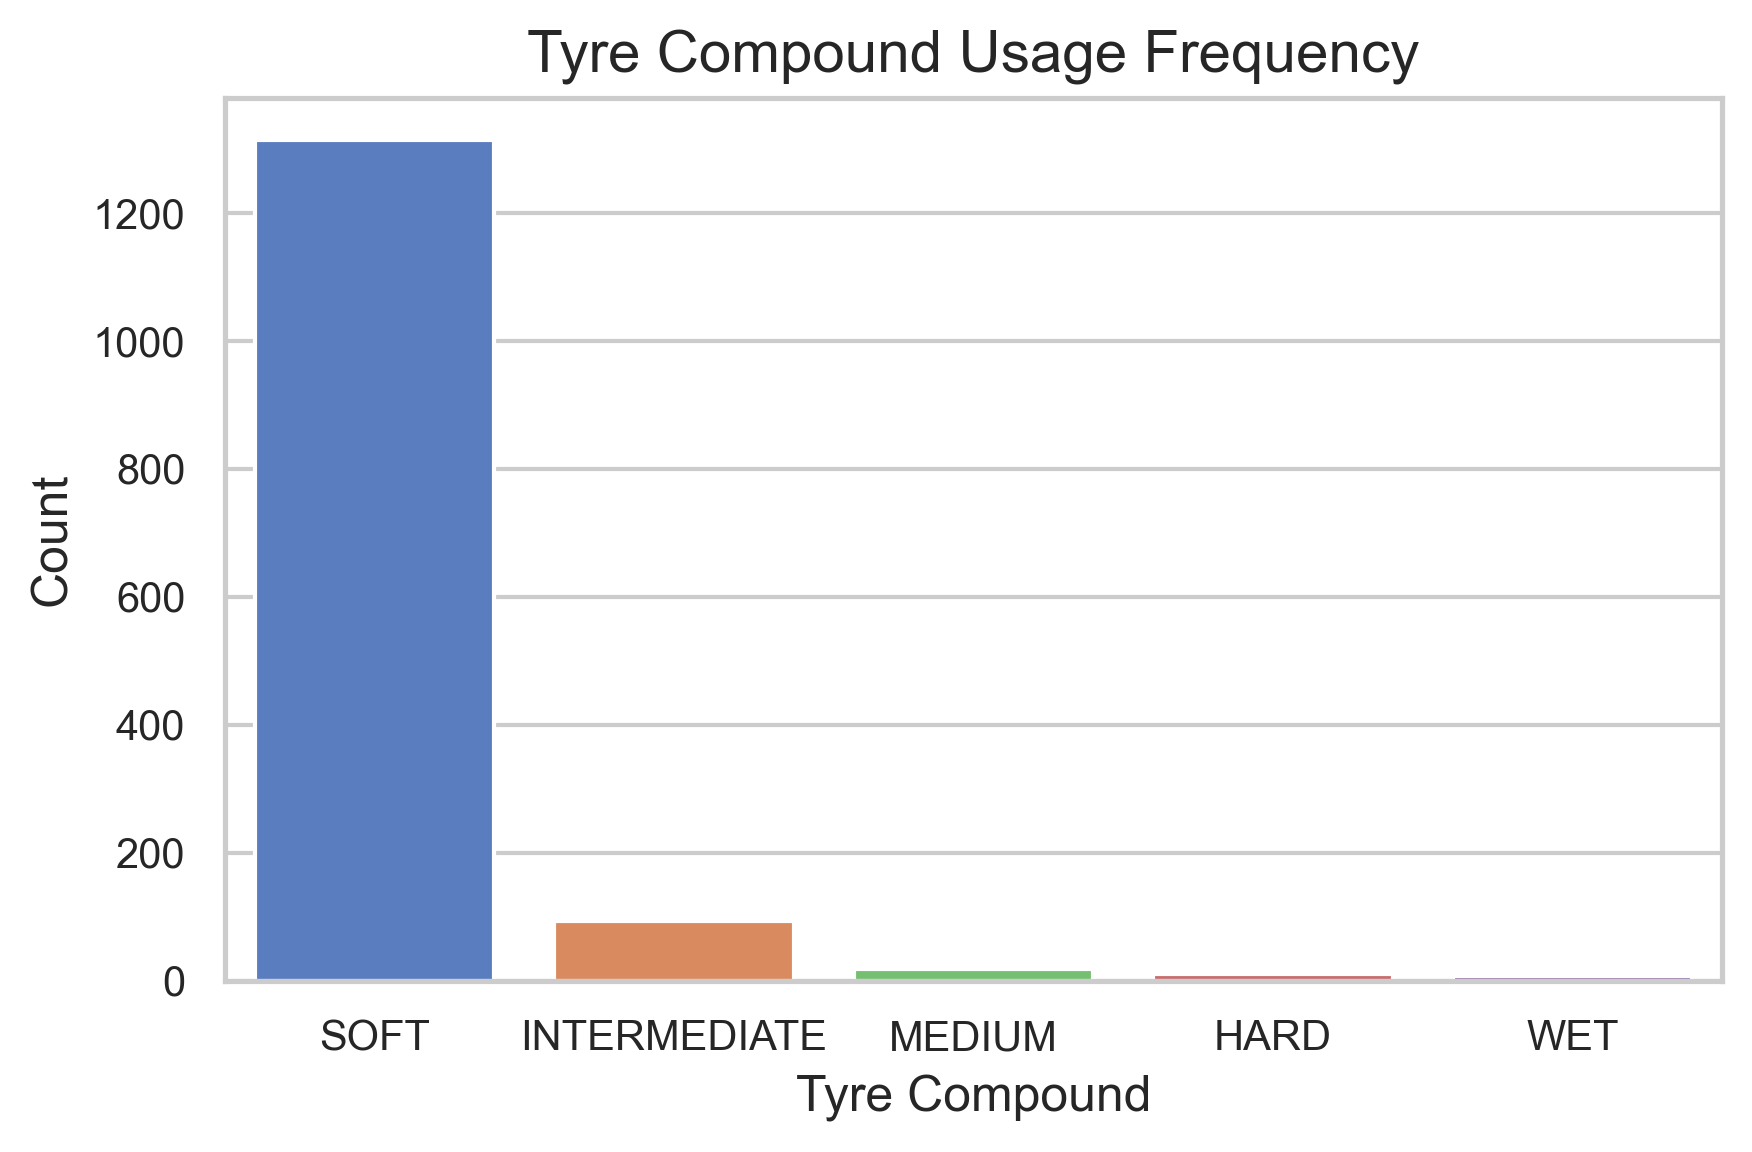
The lap time vs. tyre compound plot shows that soft tyres consistently produce the fastest lap times due to their superior grip. Medium and hard tyres are occasionally used in dry conditions for strategic reasons, such as preserving soft sets. The compound usage frequency plot supports this trend. In wet conditions, drivers switch to intermediate or wet tyres, which yield slower lap times. The tyre life plot further confirms that fresher tyres generally result in faster qualifying laps.
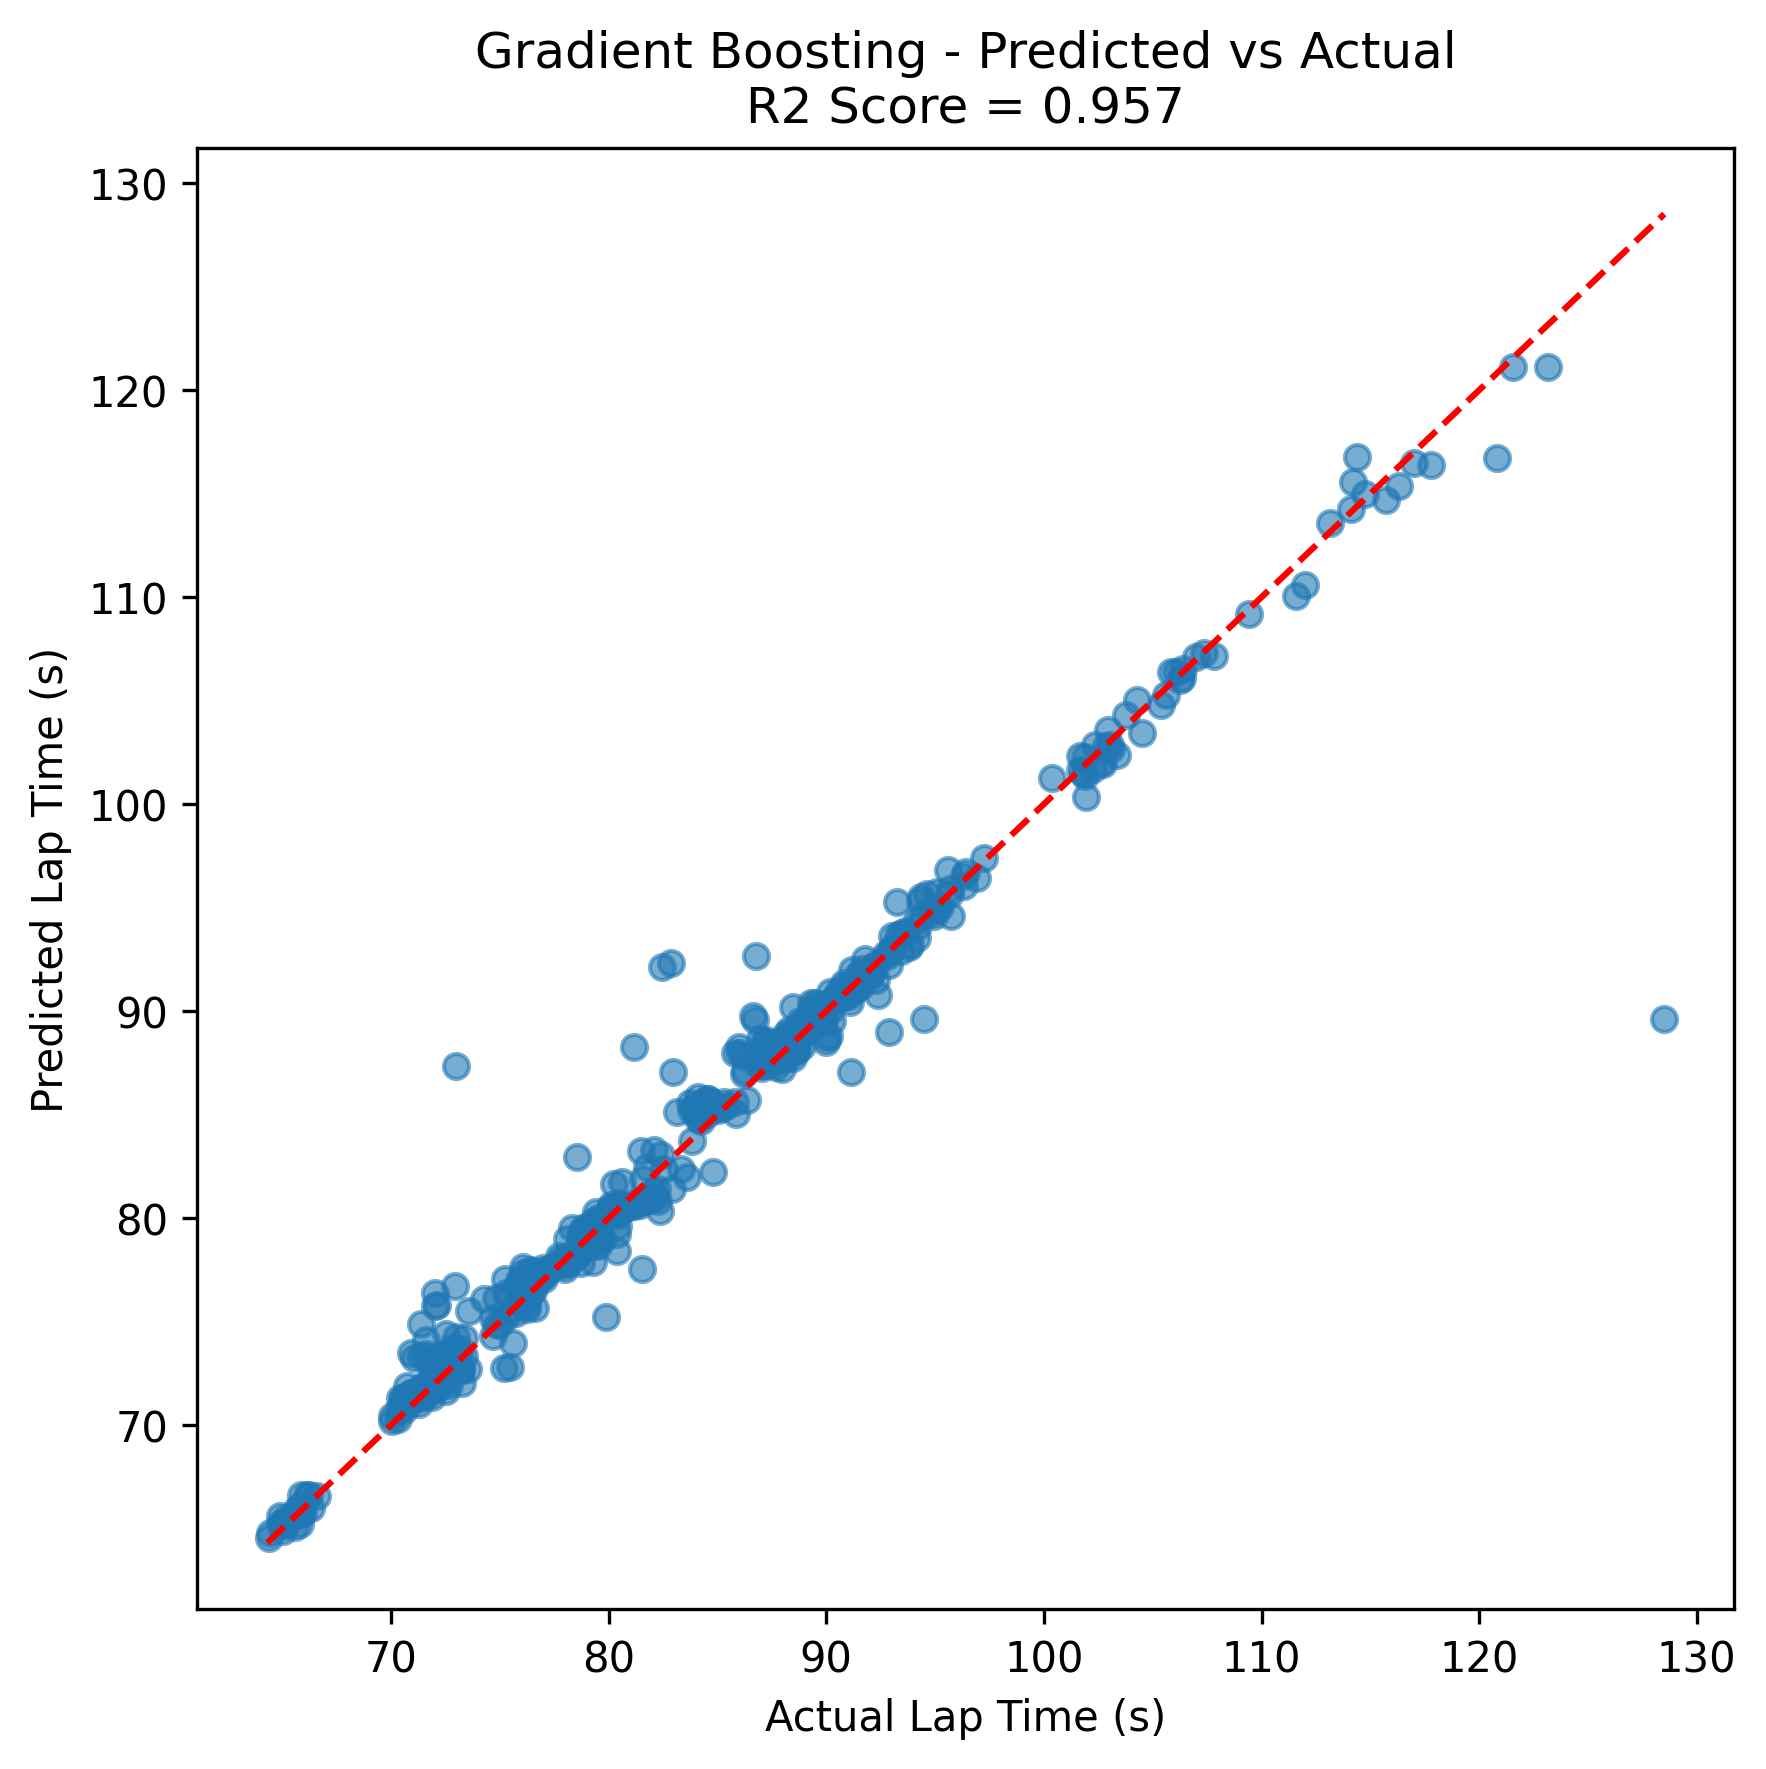
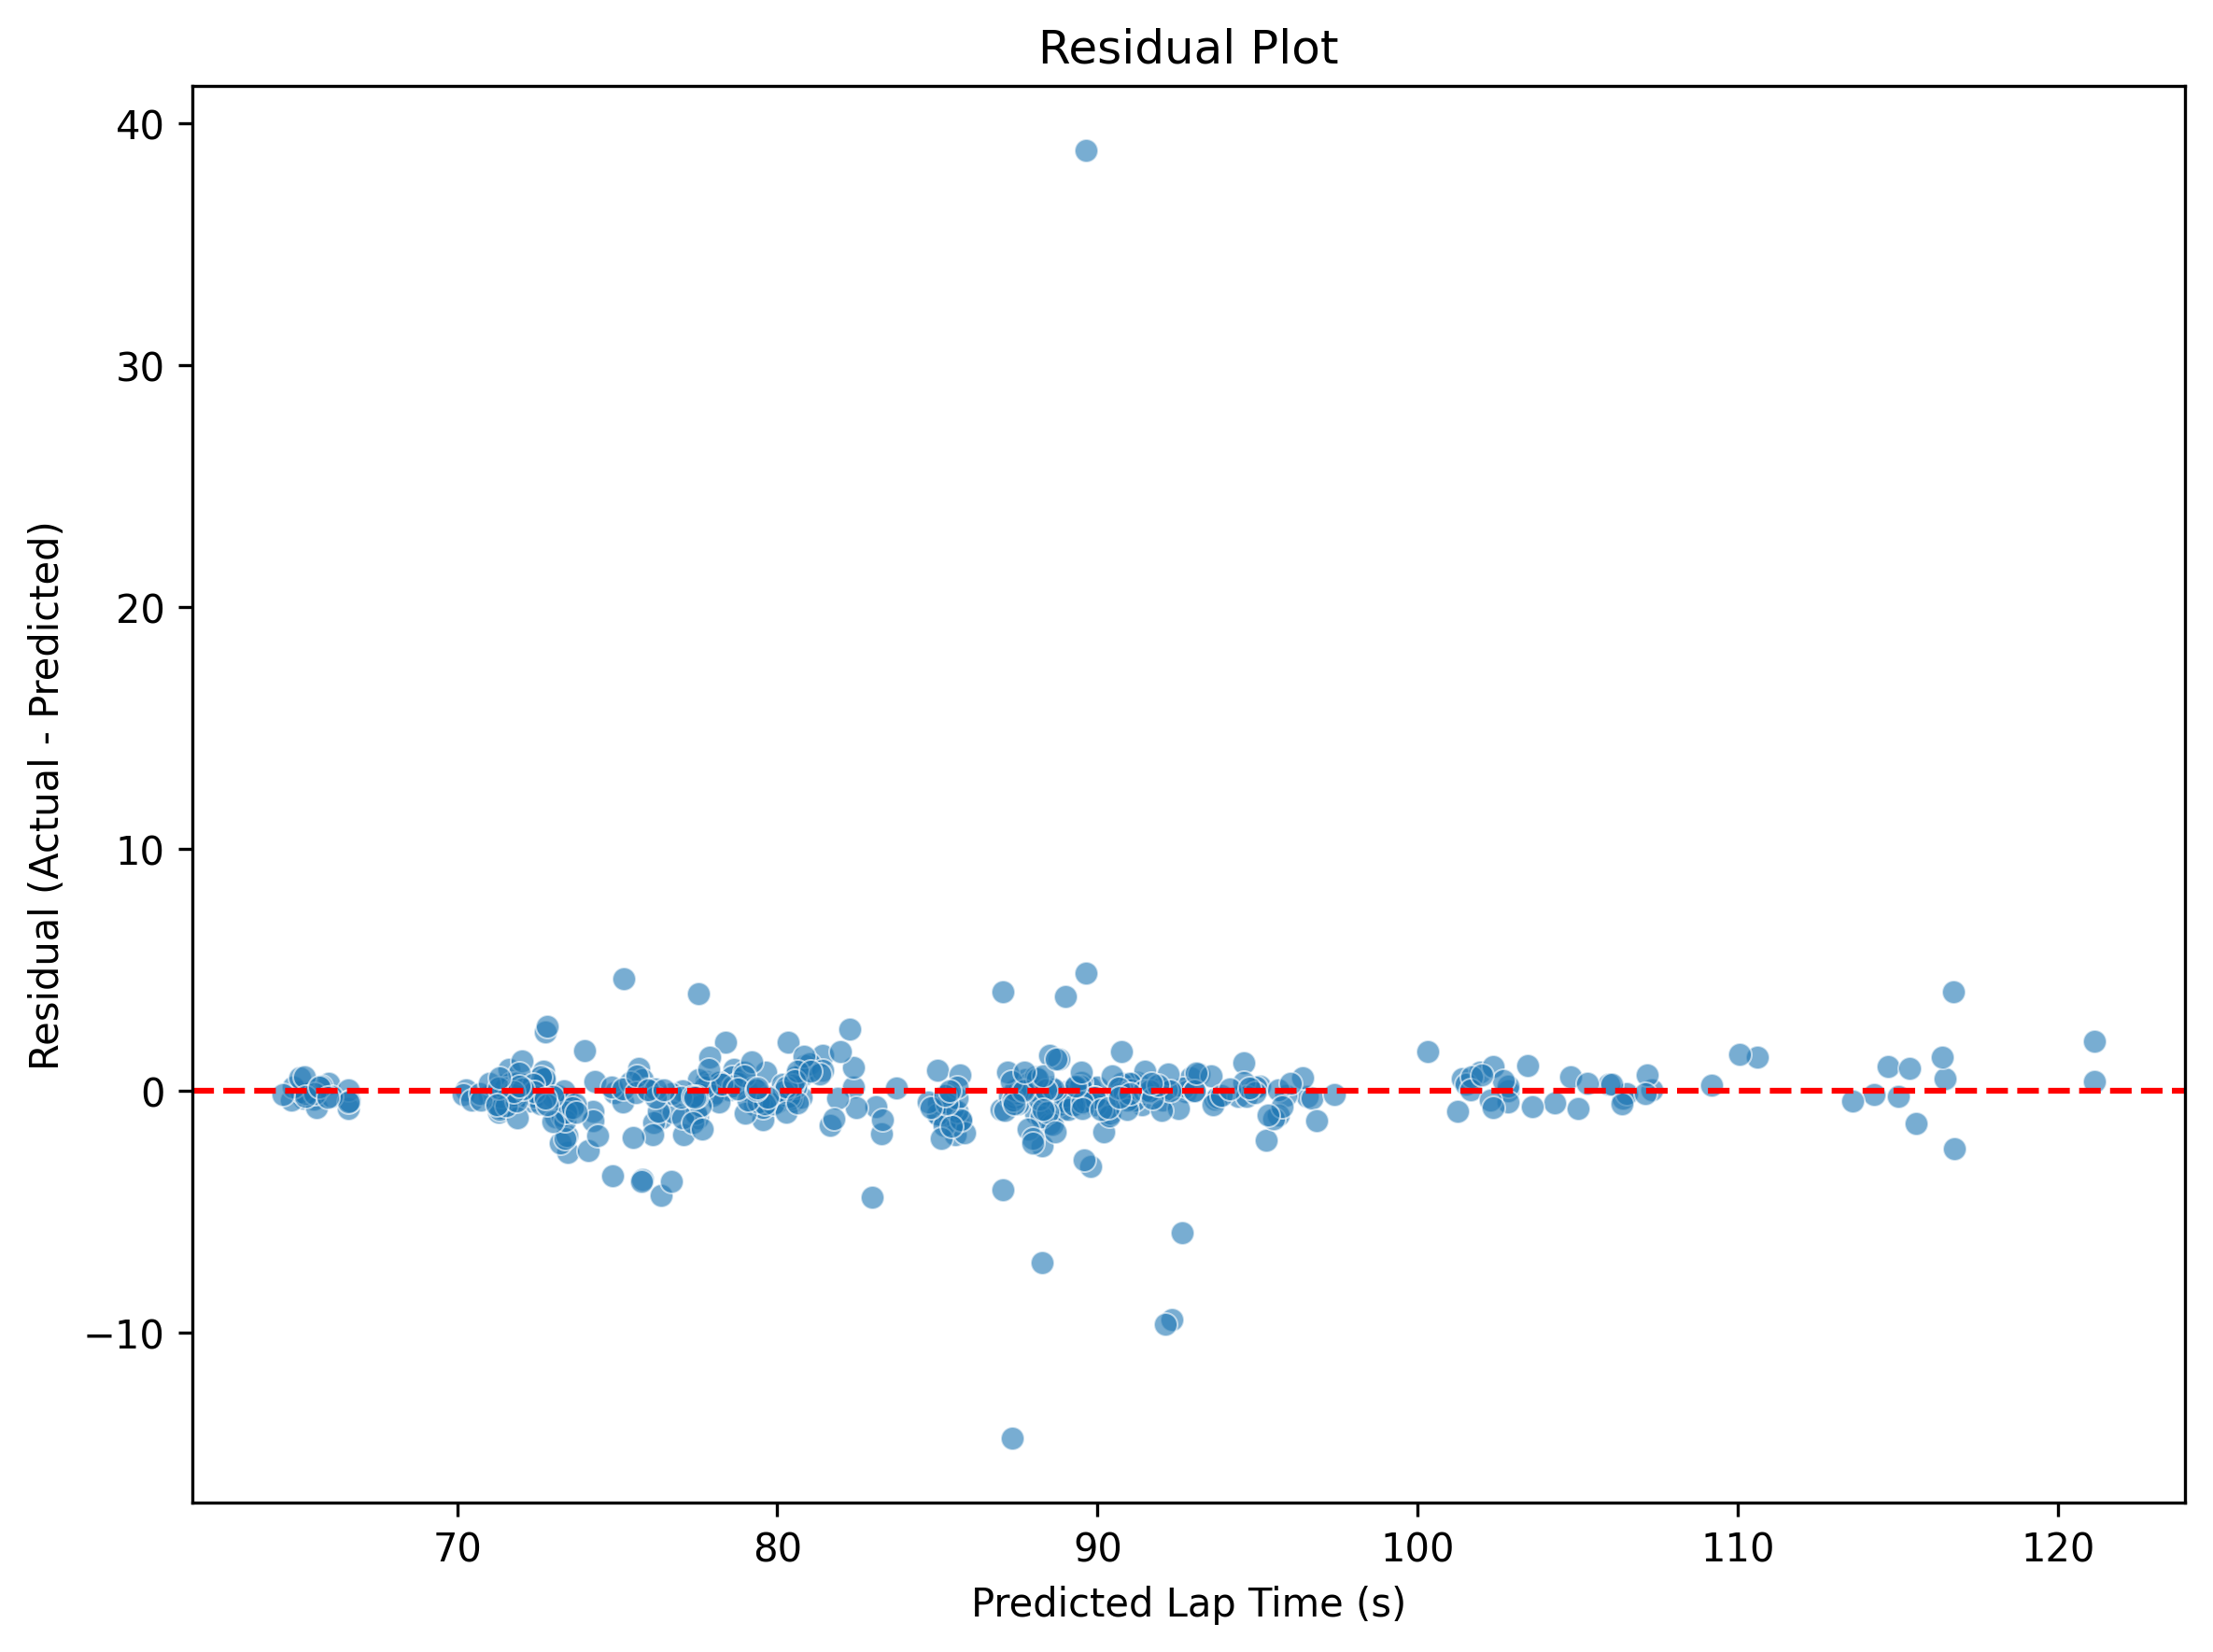
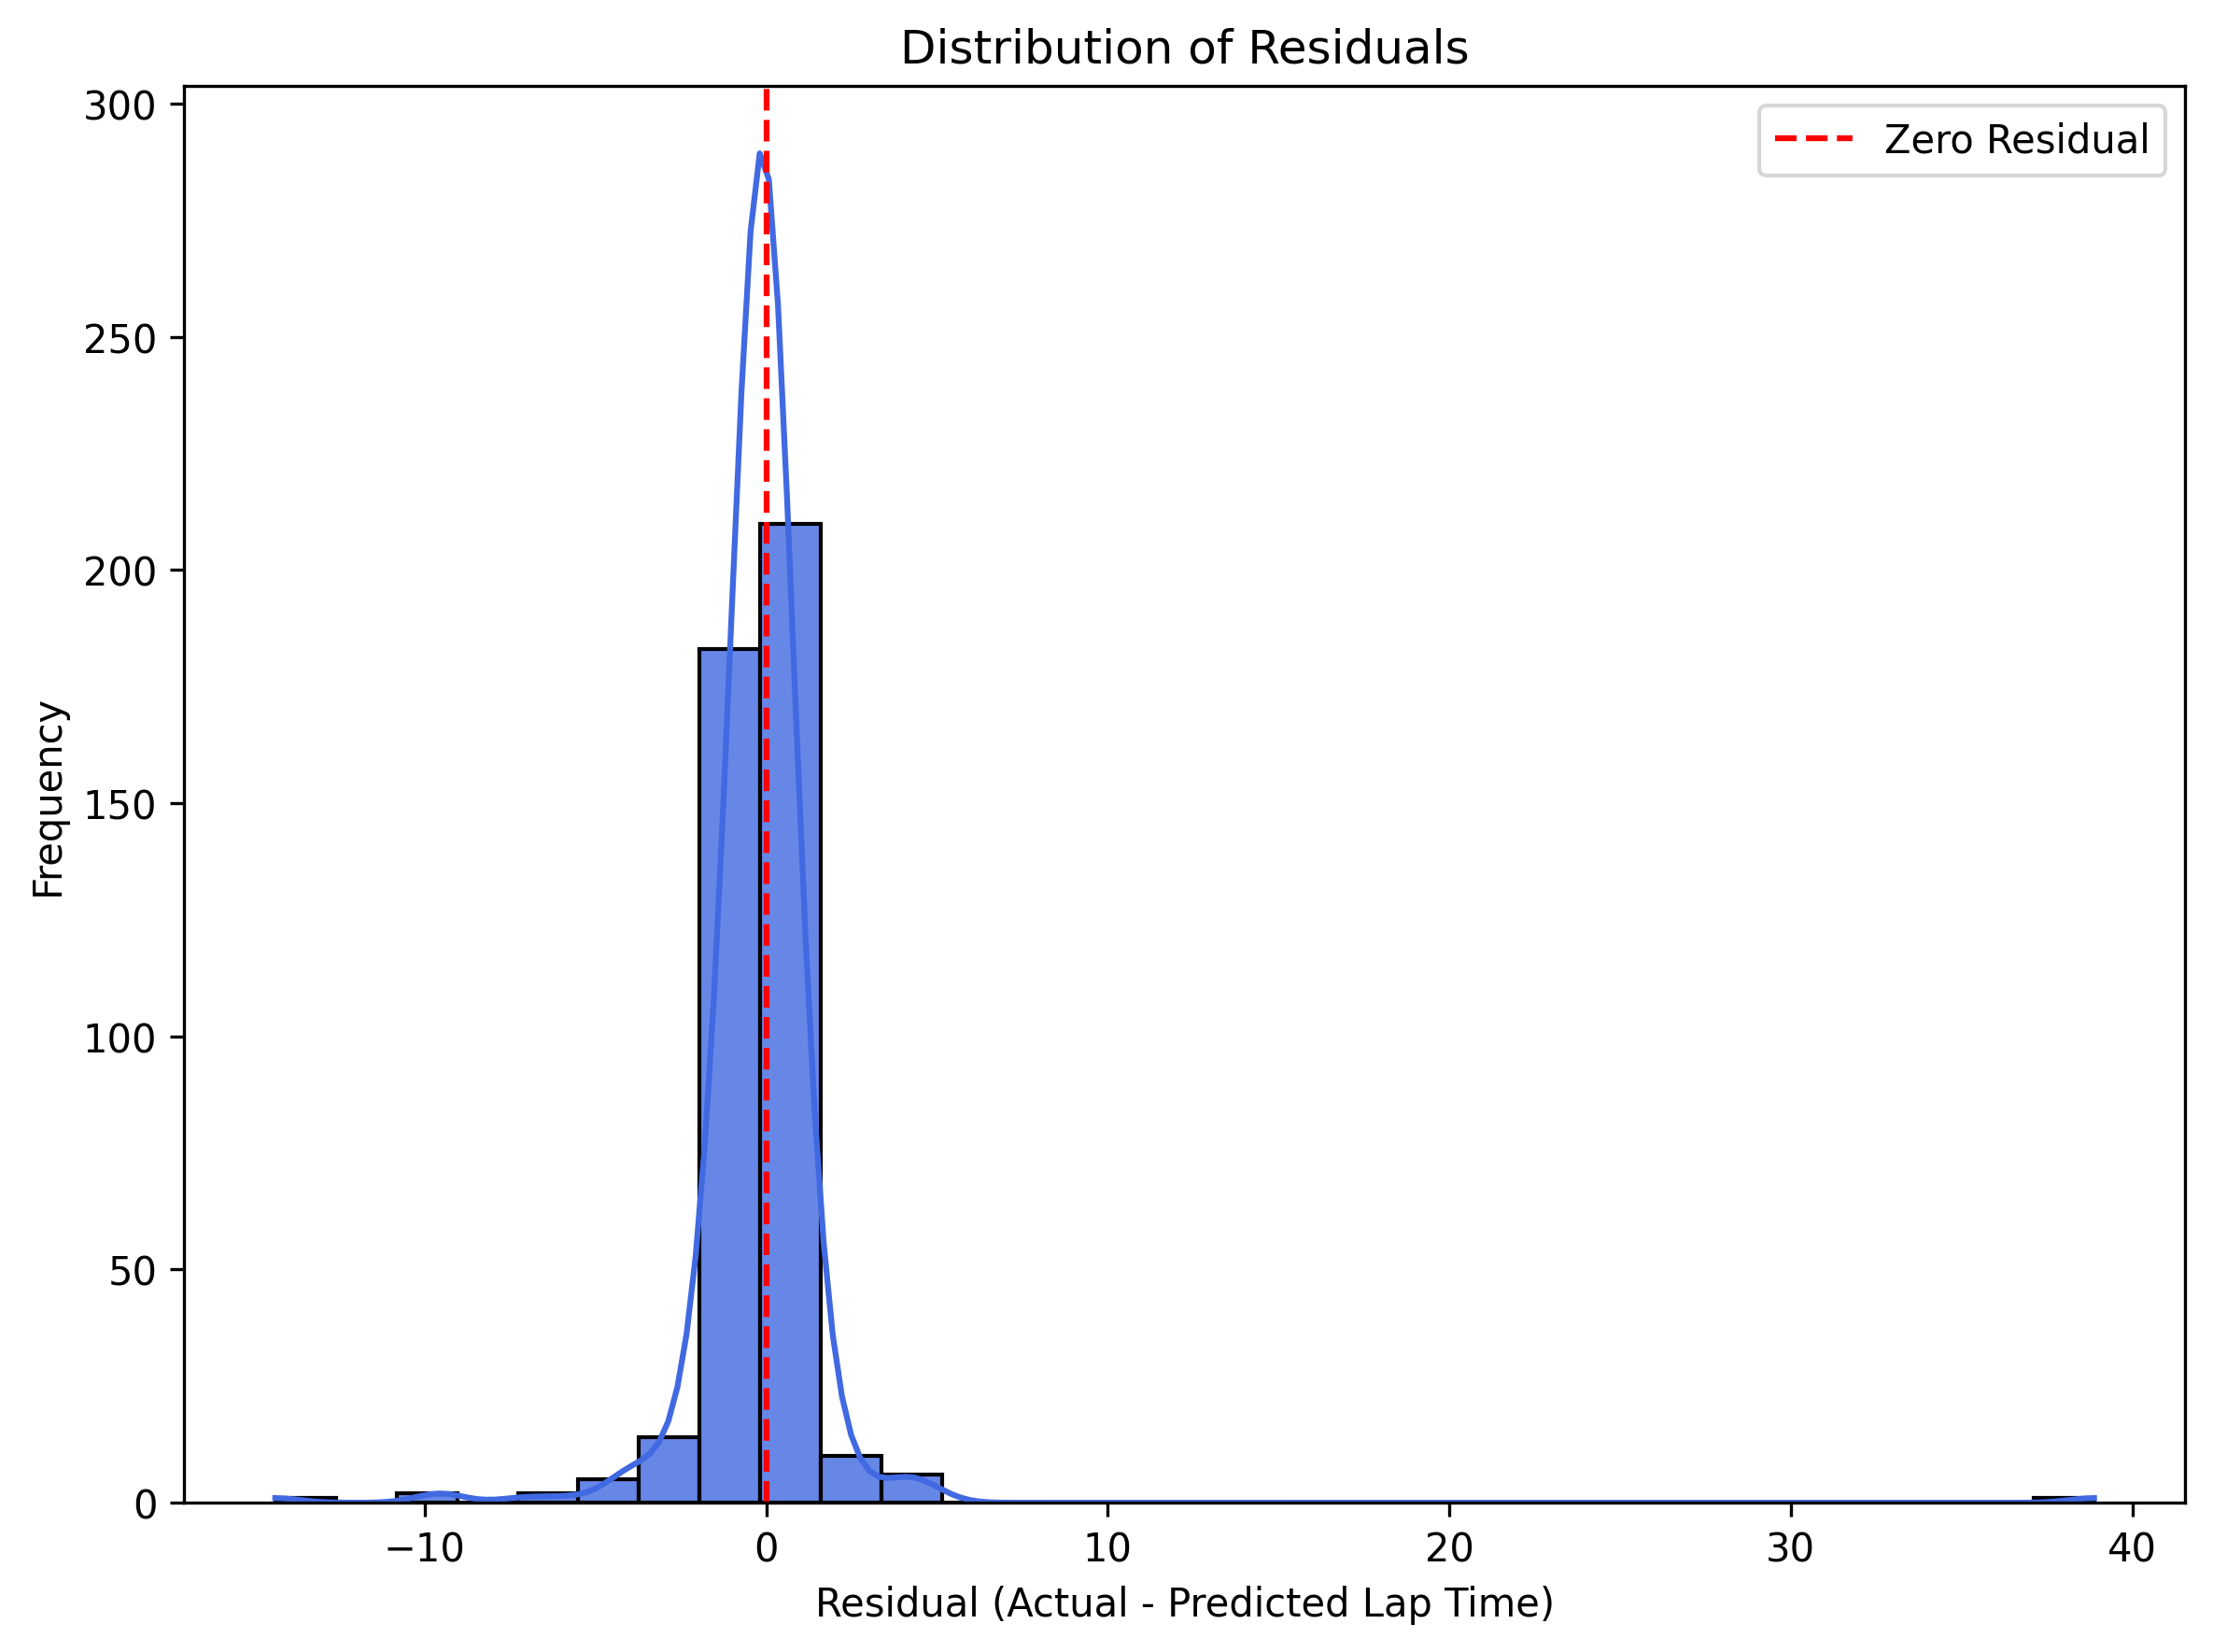
The Predicted vs Actual plot shows a strong linear relationship between predicted and actual qualifying lap times, with most points lying close to the diagonal, indicating high prediction accuracy. Additionally, the Residual Plot (Actual − Predicted) shows that residuals are mostly centered around zero, with no strong pattern, suggesting that the model is unbiased across the prediction range. The Residual Distribution plot further confirms this, showing a roughly normal distribution of residuals with a sharp peak near zero indicating low variance.
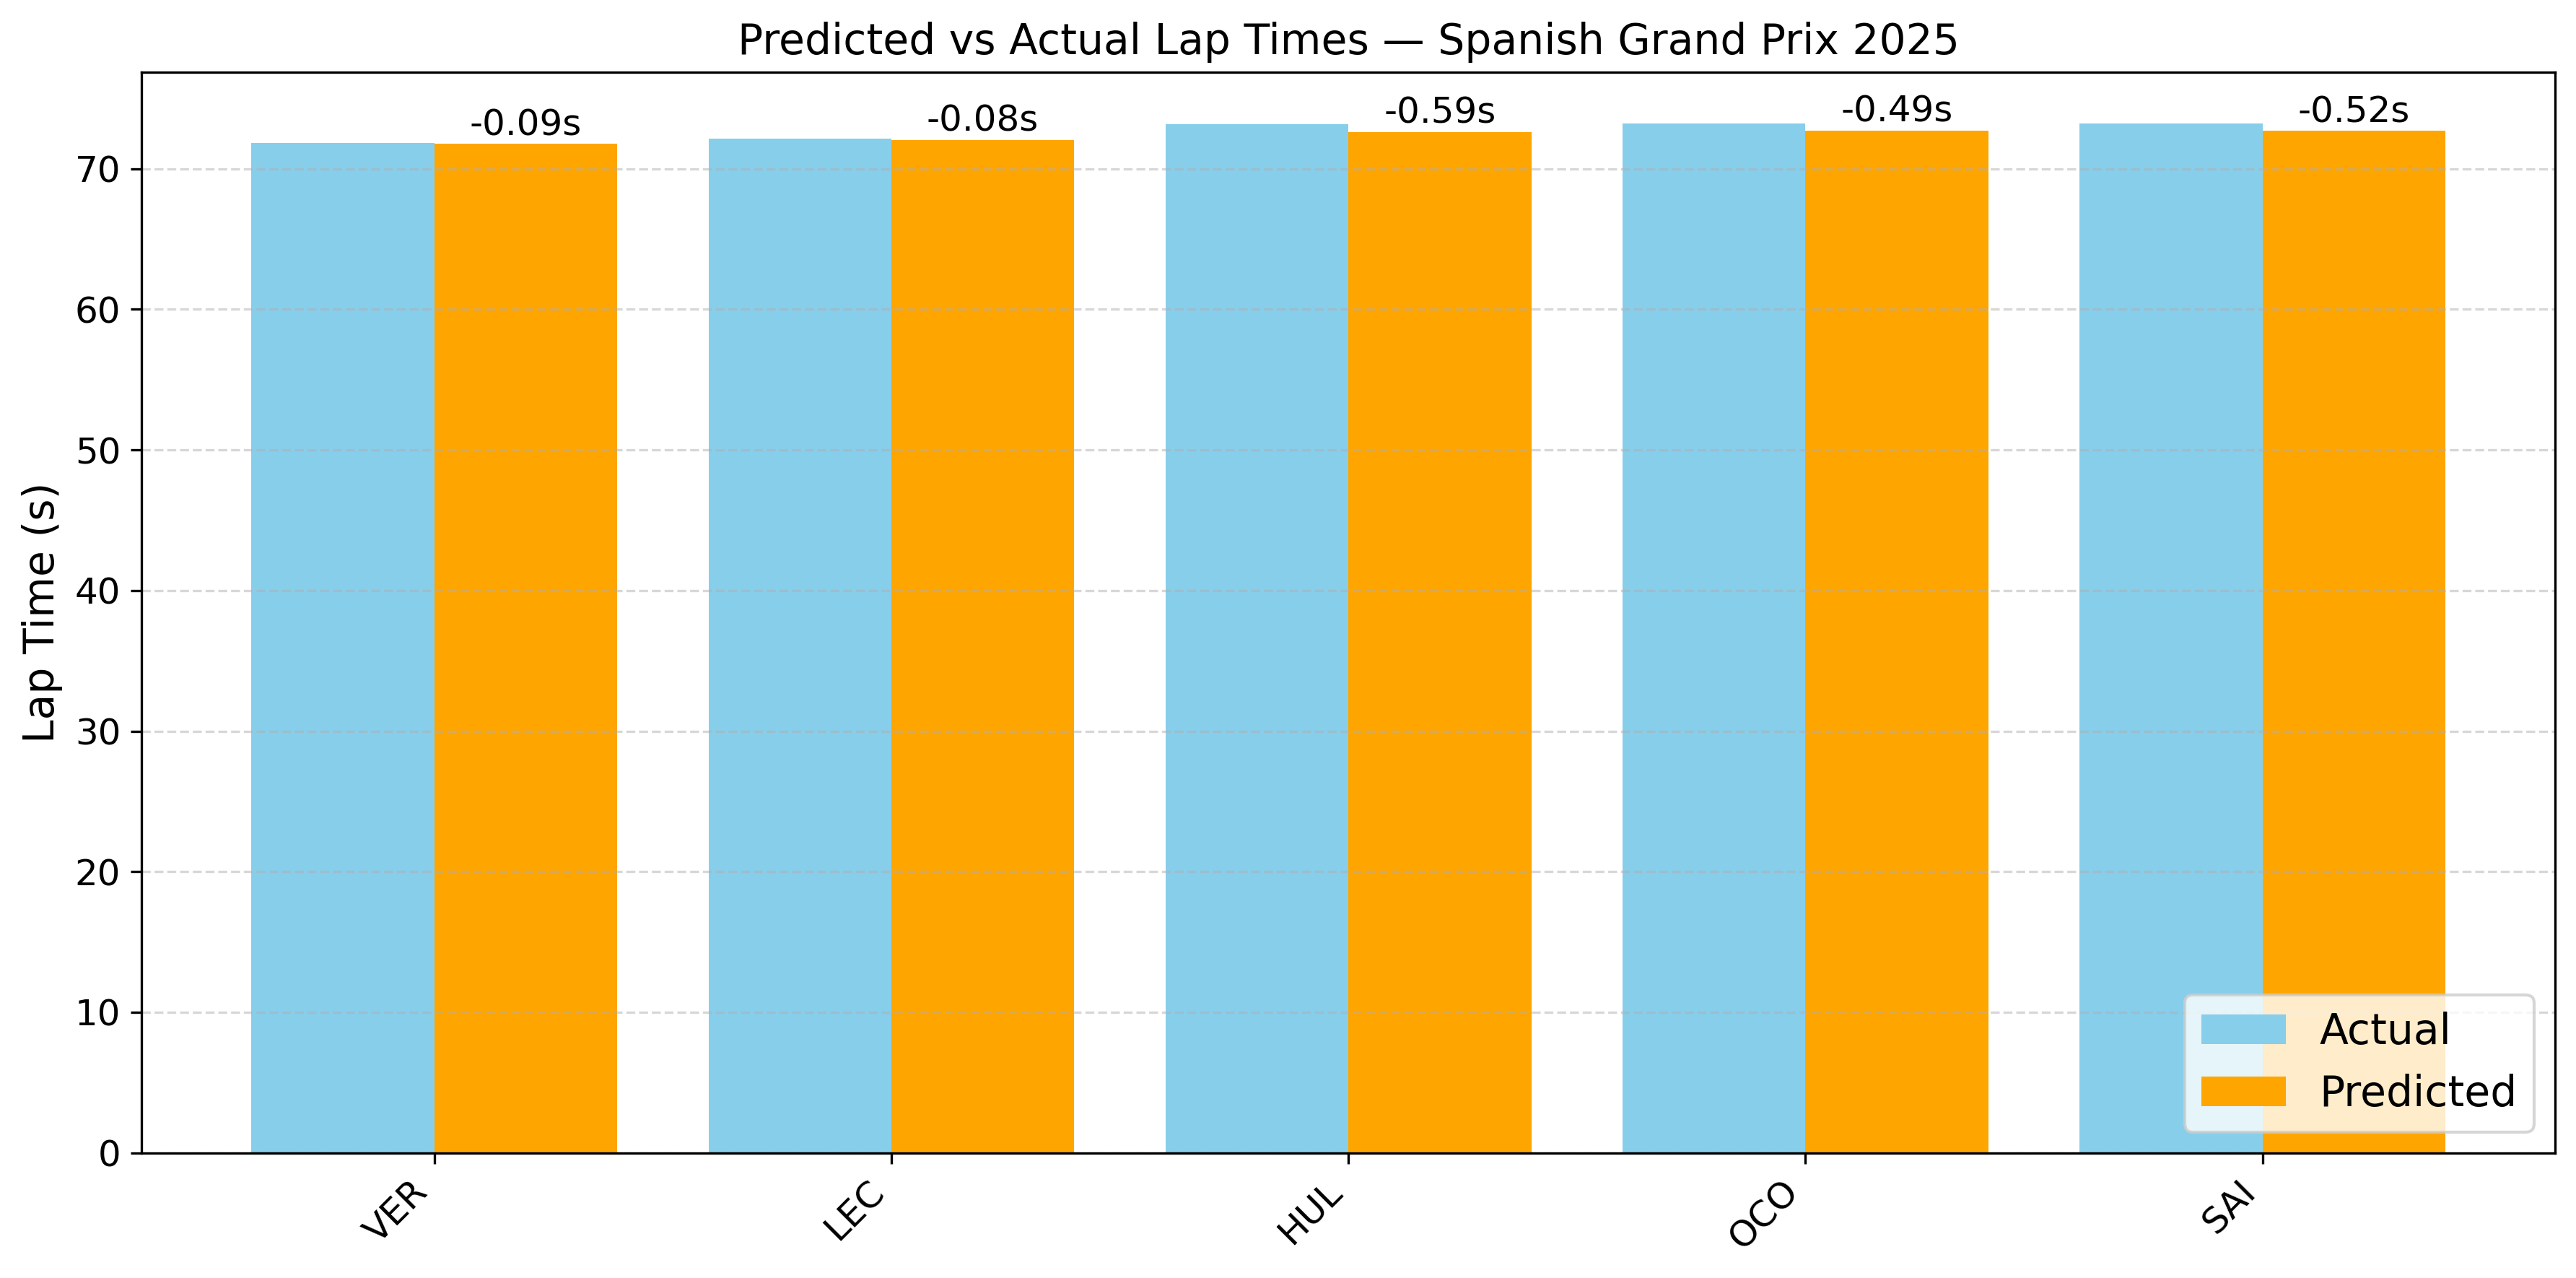
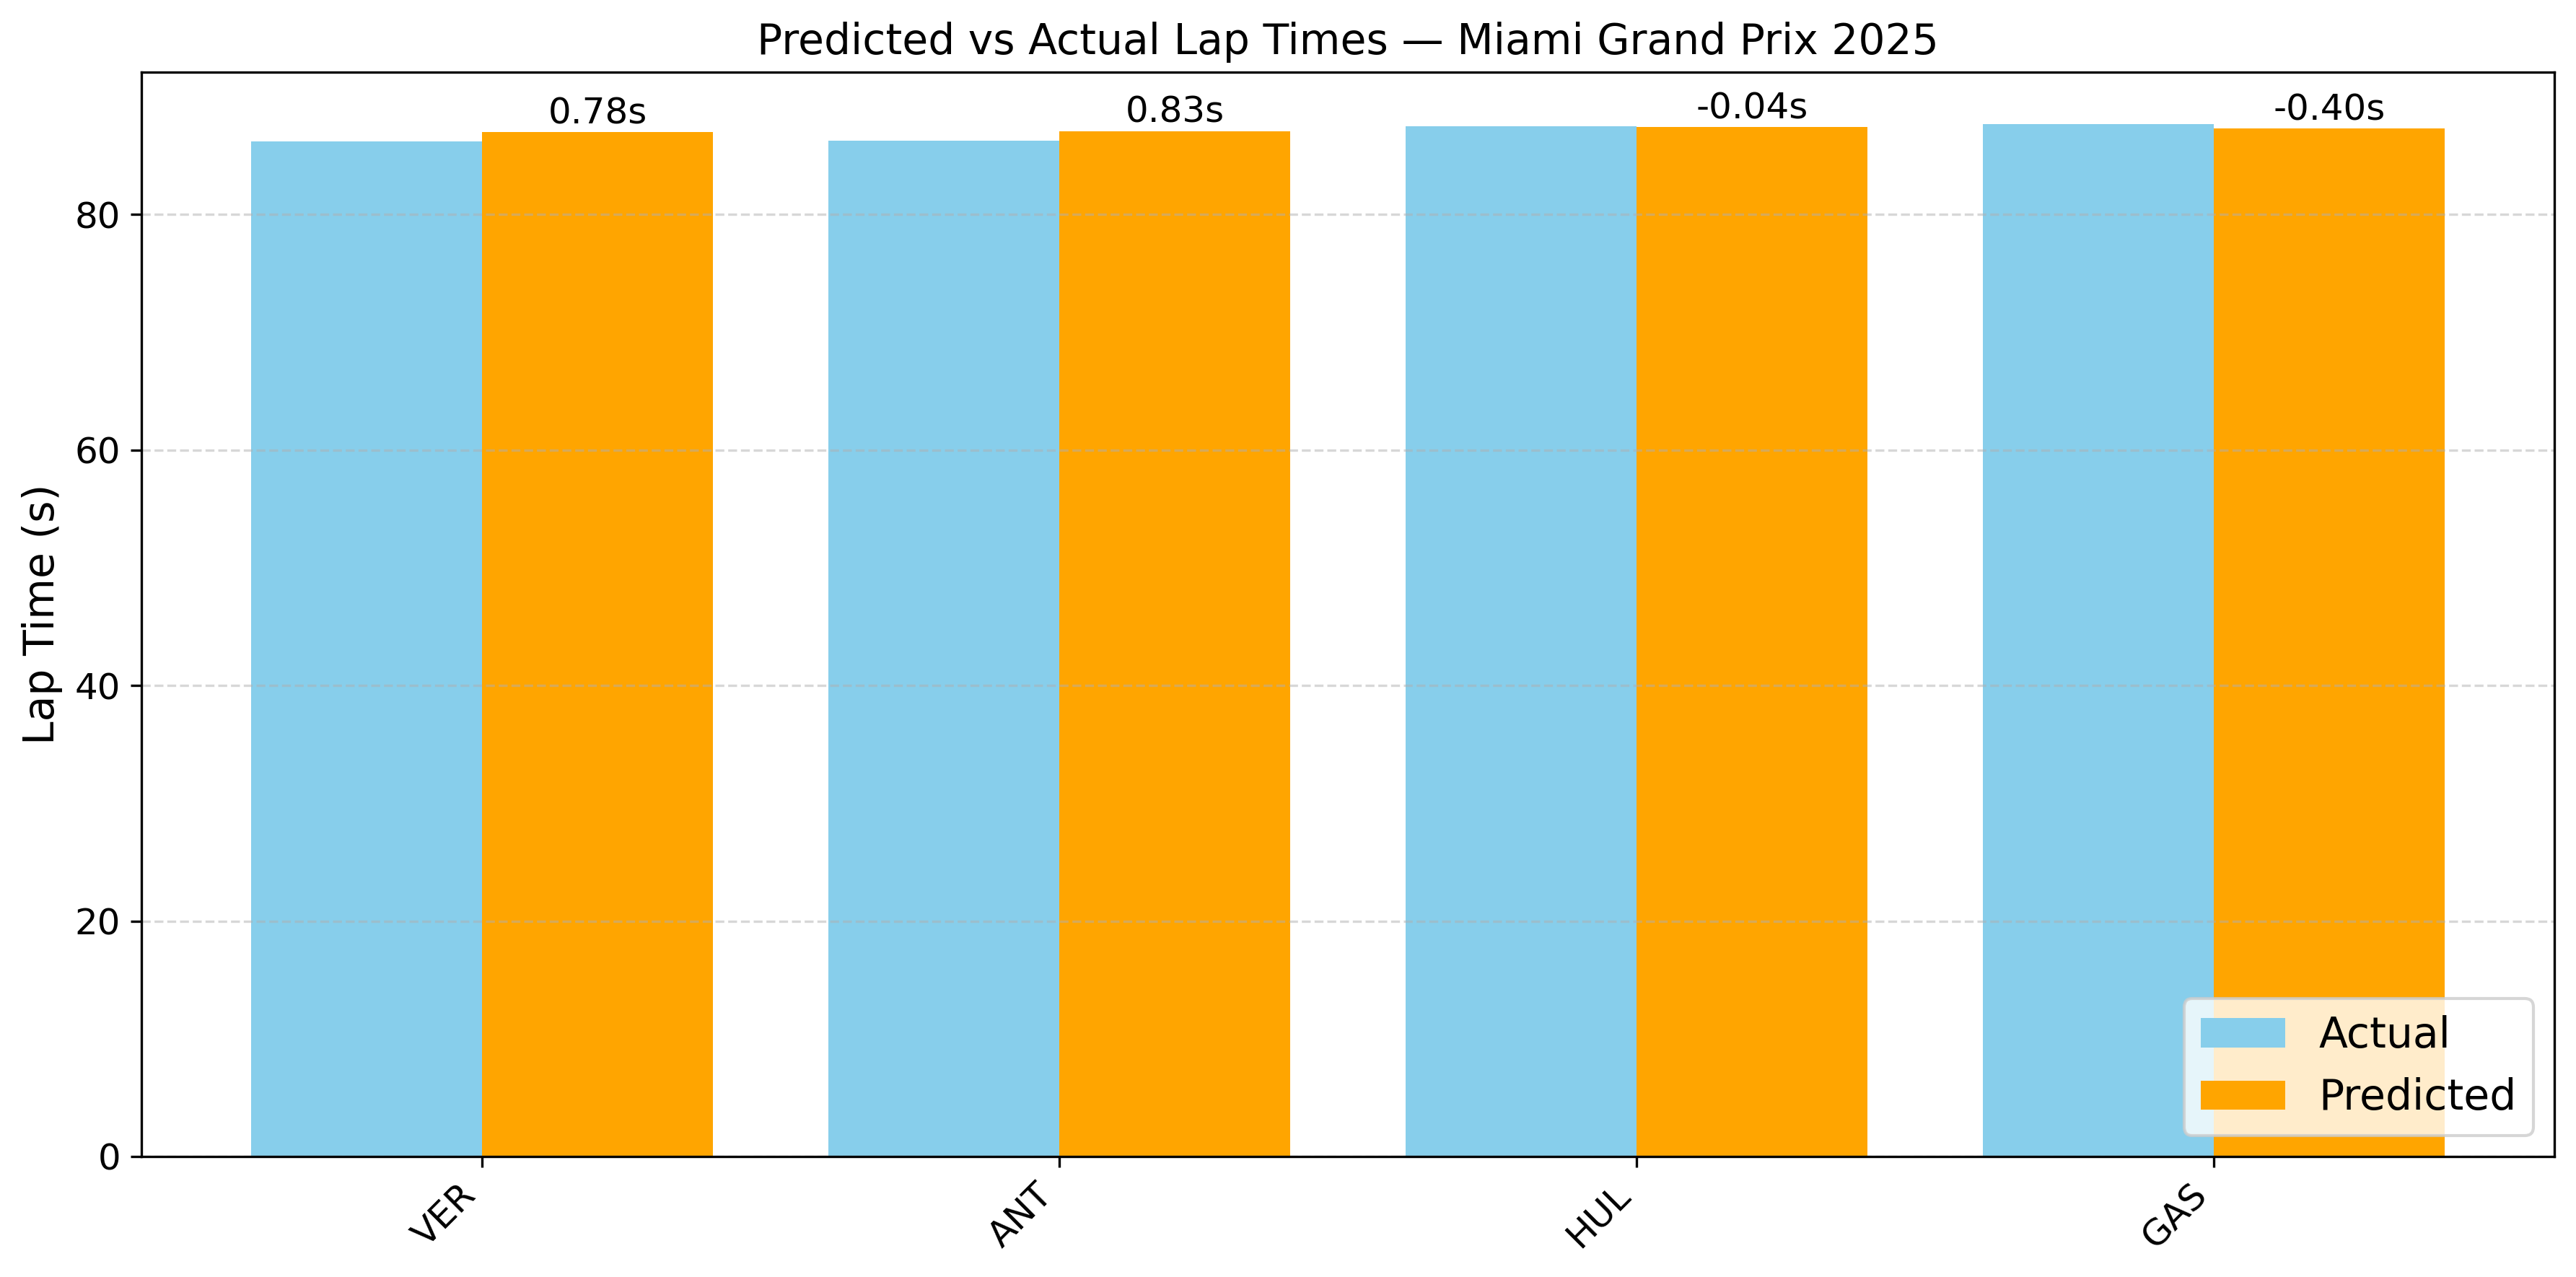
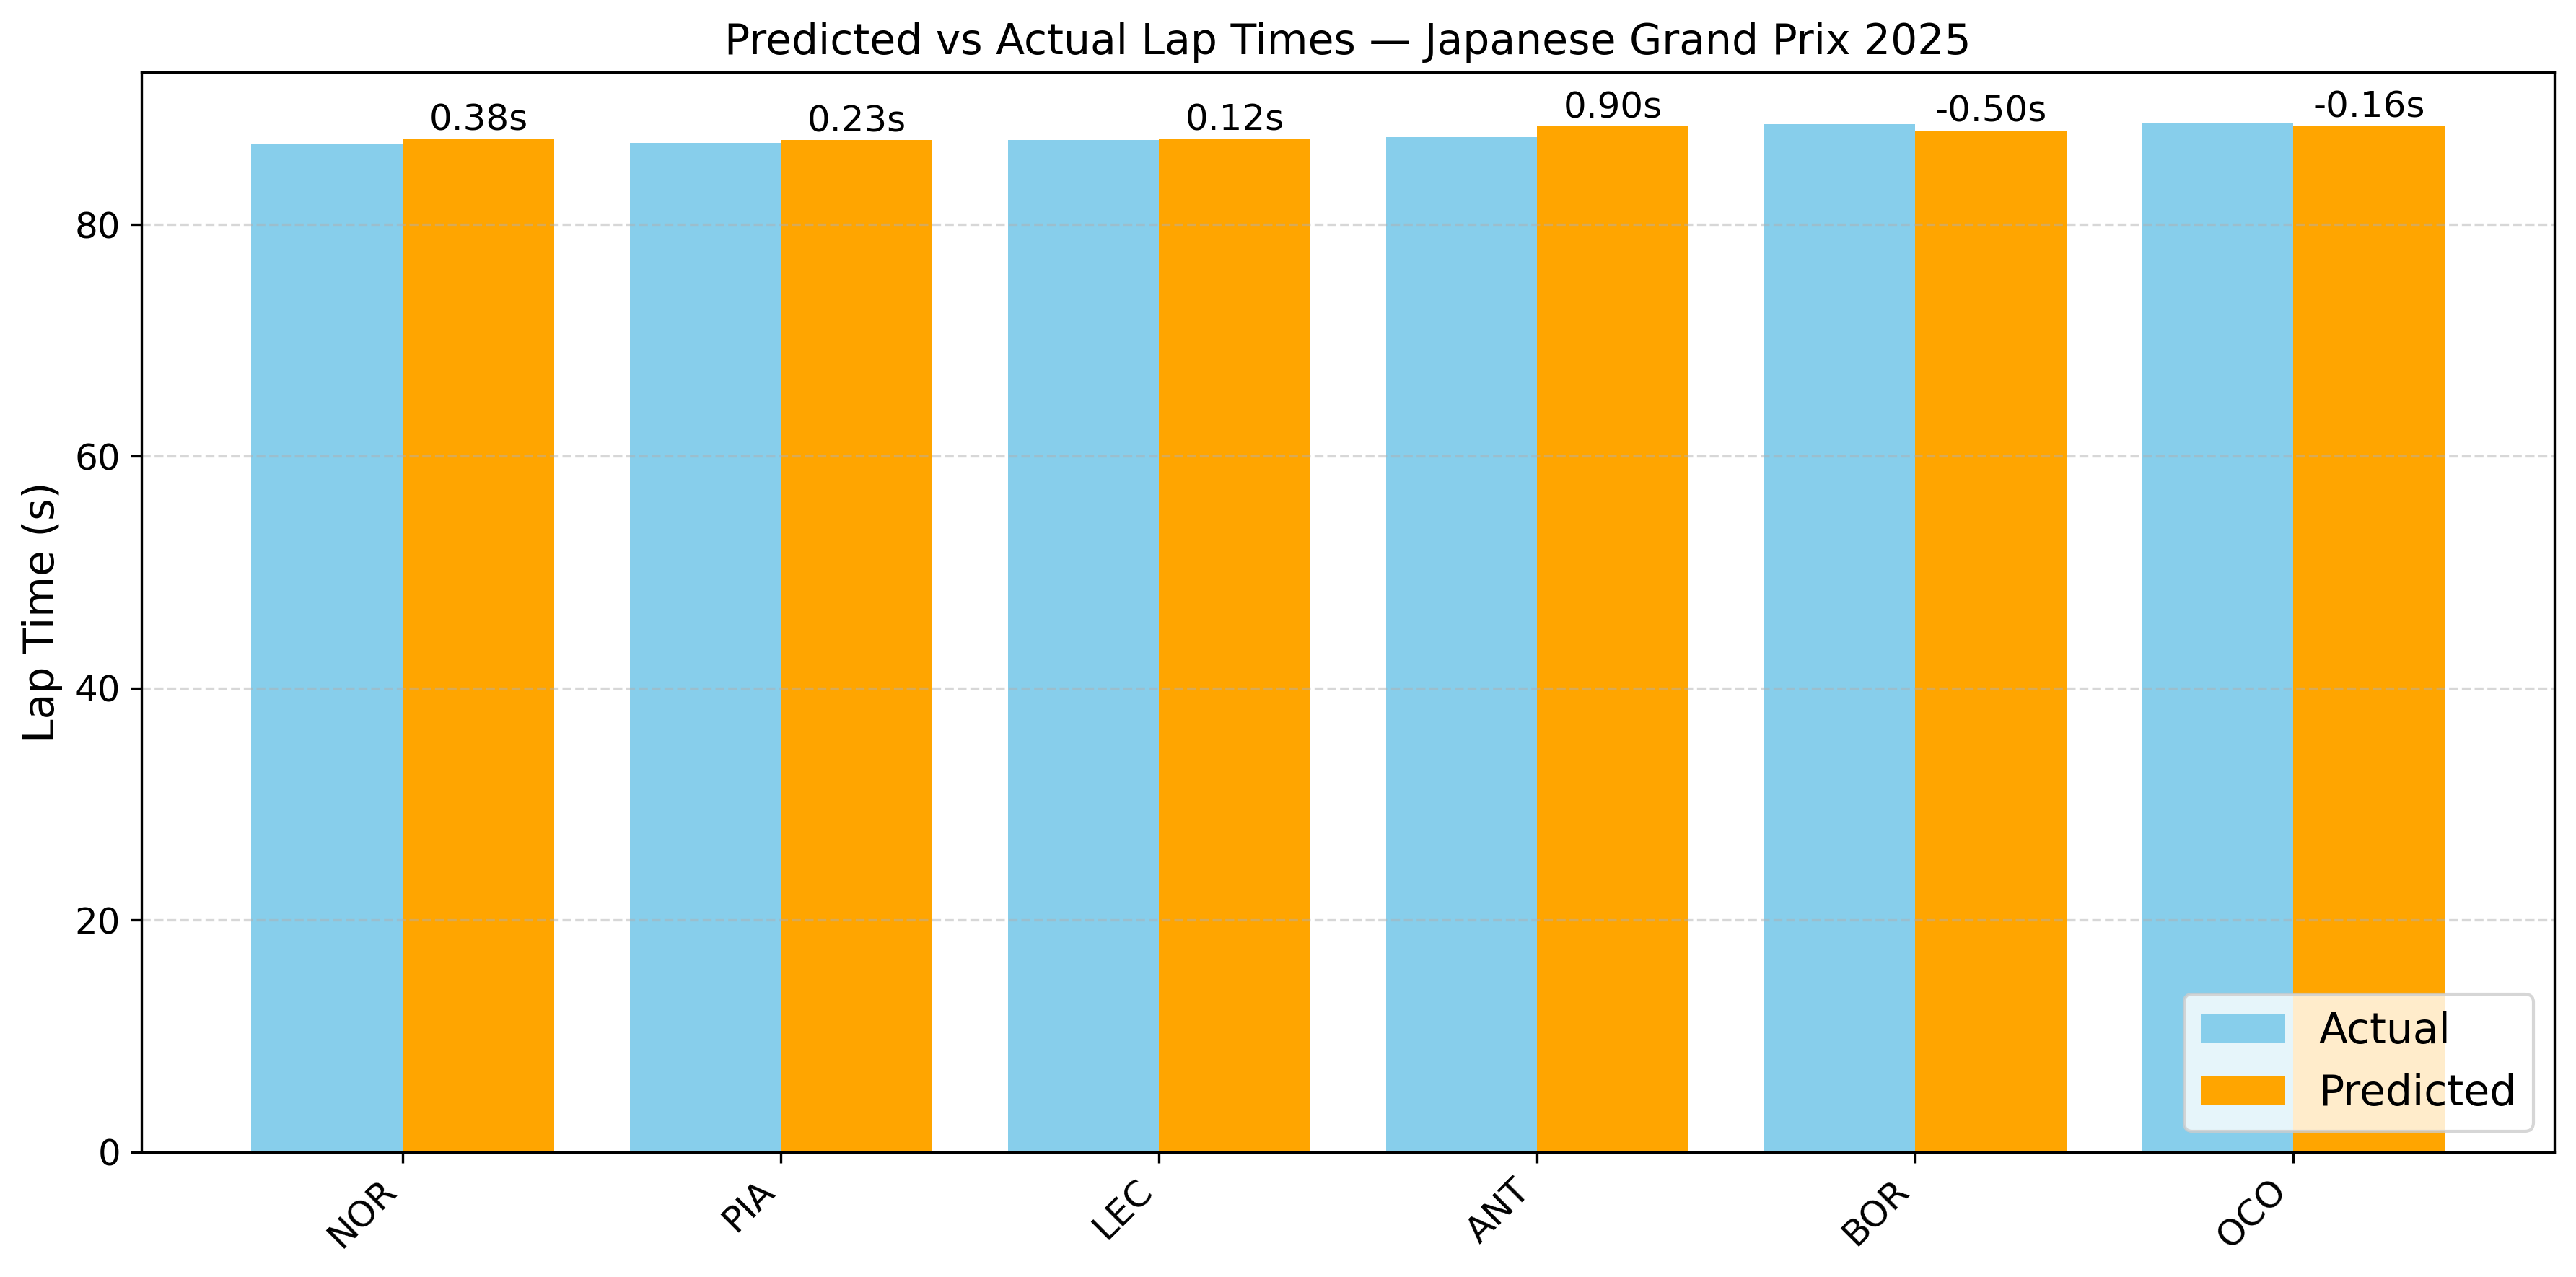
To evaluate the model’s performance, the qualifying lap times were predicted for the latest races of the 2025 F1 season (The data for these races was not used in the model training). For the Japanese and Australian GP, the model predicted lap times with high accuracy for all drivers, with errors mostly below 0.3 seconds, demonstrating strong consistency. In contrast, the Spanish, and Miami GP shows larger deviations for some drivers (up to 0.8 seconds), suggesting potential anomalies in session conditions or driver-specific factors not captured by the model.

Quantitative Metrics
| Model | MAE | RMSE | R² |
|---|---|---|---|
| Gradient Boosting | 0.9043 | 2.3977 | 0.957 |
| Random Forest | 0.9042 | 2.4827 | 0.954 |
| Support Vector Regression | 1.0316 | 2.6040 | 0.950 |
| Ridge Regression | 1.3056 | 2.6785 | 0.947 |
| Linear Regression | 1.3059 | 2.6786 | 0.947 |
| Lasso Regression | 1.5069 | 2.8077 | 0.942 |
Final Model Analysis
The ensemble methods lead in prediction accuracy with the Gradient Boosting Regression model showing strong predictive performance with an R² score of 0.957 on the test set. The Random Forest regression model performed nearly identically in terms of MAE, but had a slightly higher RMSE and lower R². Furthermore, SVR performs competitively, despite being a non-ensemble model. It offers strong performance, suggesting it captures the underlying non-linear relationships between features effectively. Linear and Ridge regression models show identical performance, with both having similar metrics, indicating that regularization in Ridge has minimal effect, possibly due to well-behaved features. Finally, Lasso regression underperforms relative to the other models, likely due to its feature selection nature which may have discarded relevant predictors in this complex dataset.
The predicted vs actual plot shows a near-linear alignment, while the residual plots confirms that errors were mostly centered around zero and normally distributed, indicating minimal bias and consistent performance across a wide range of lap times.
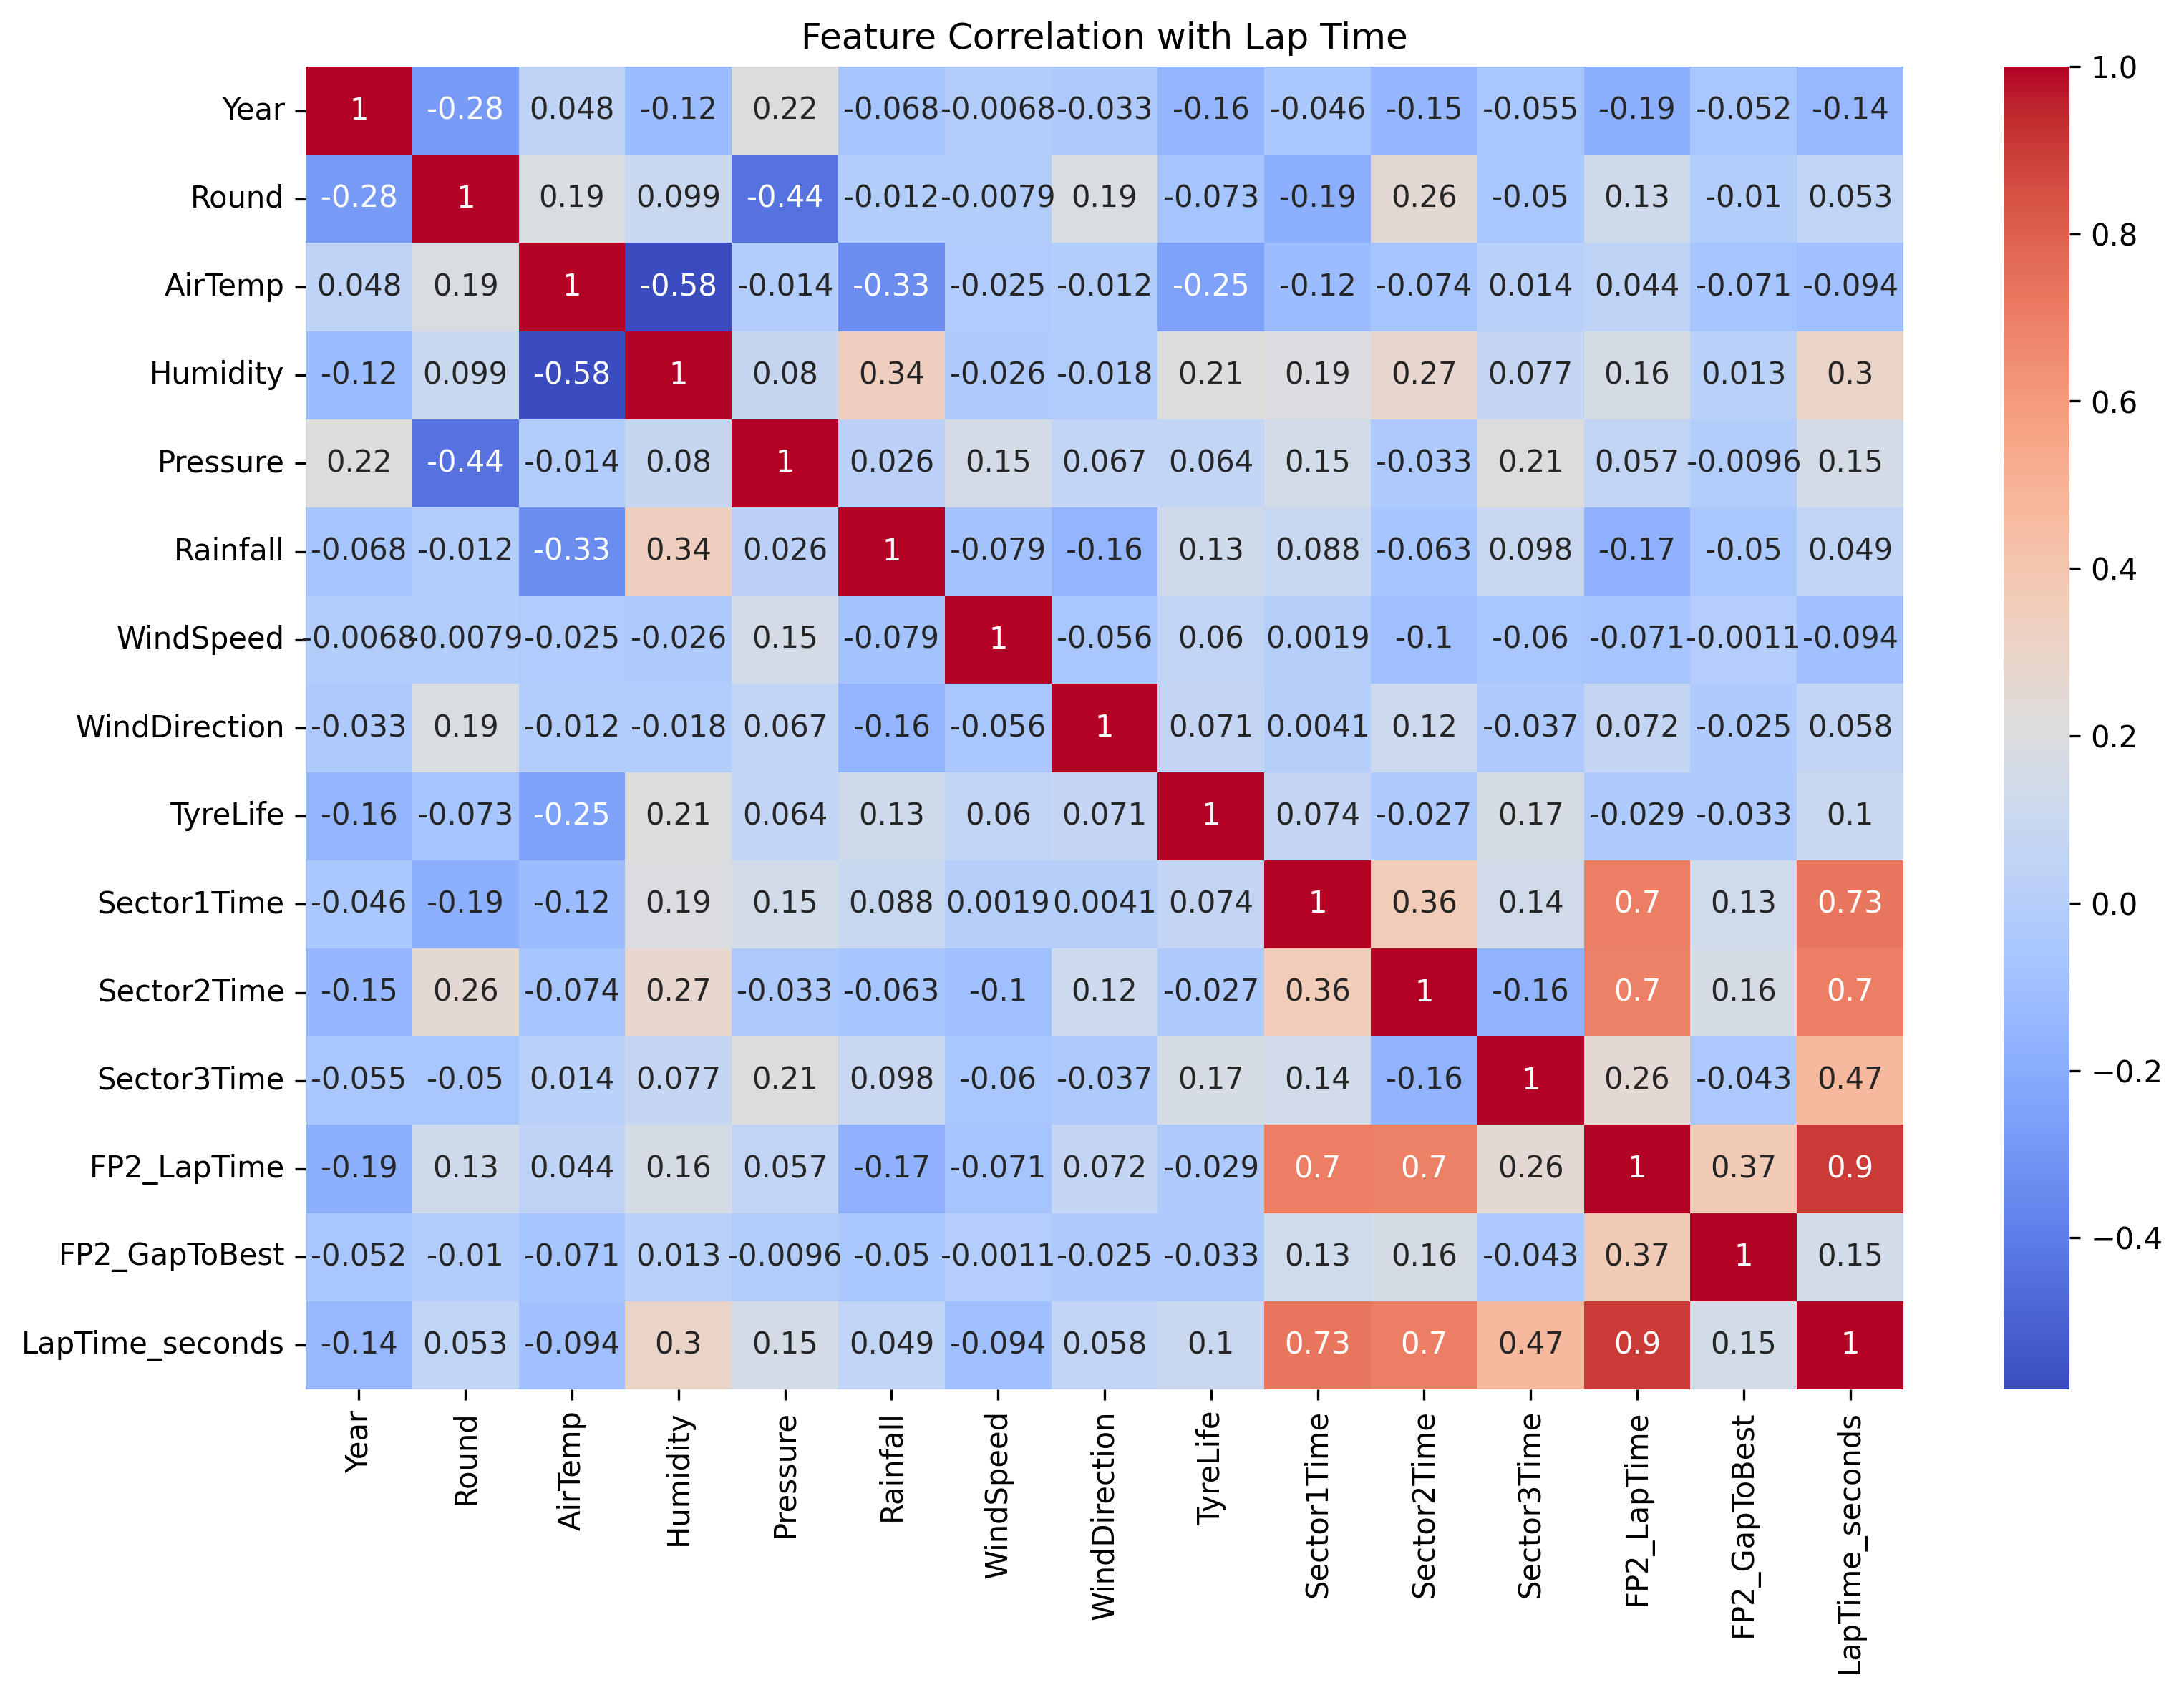
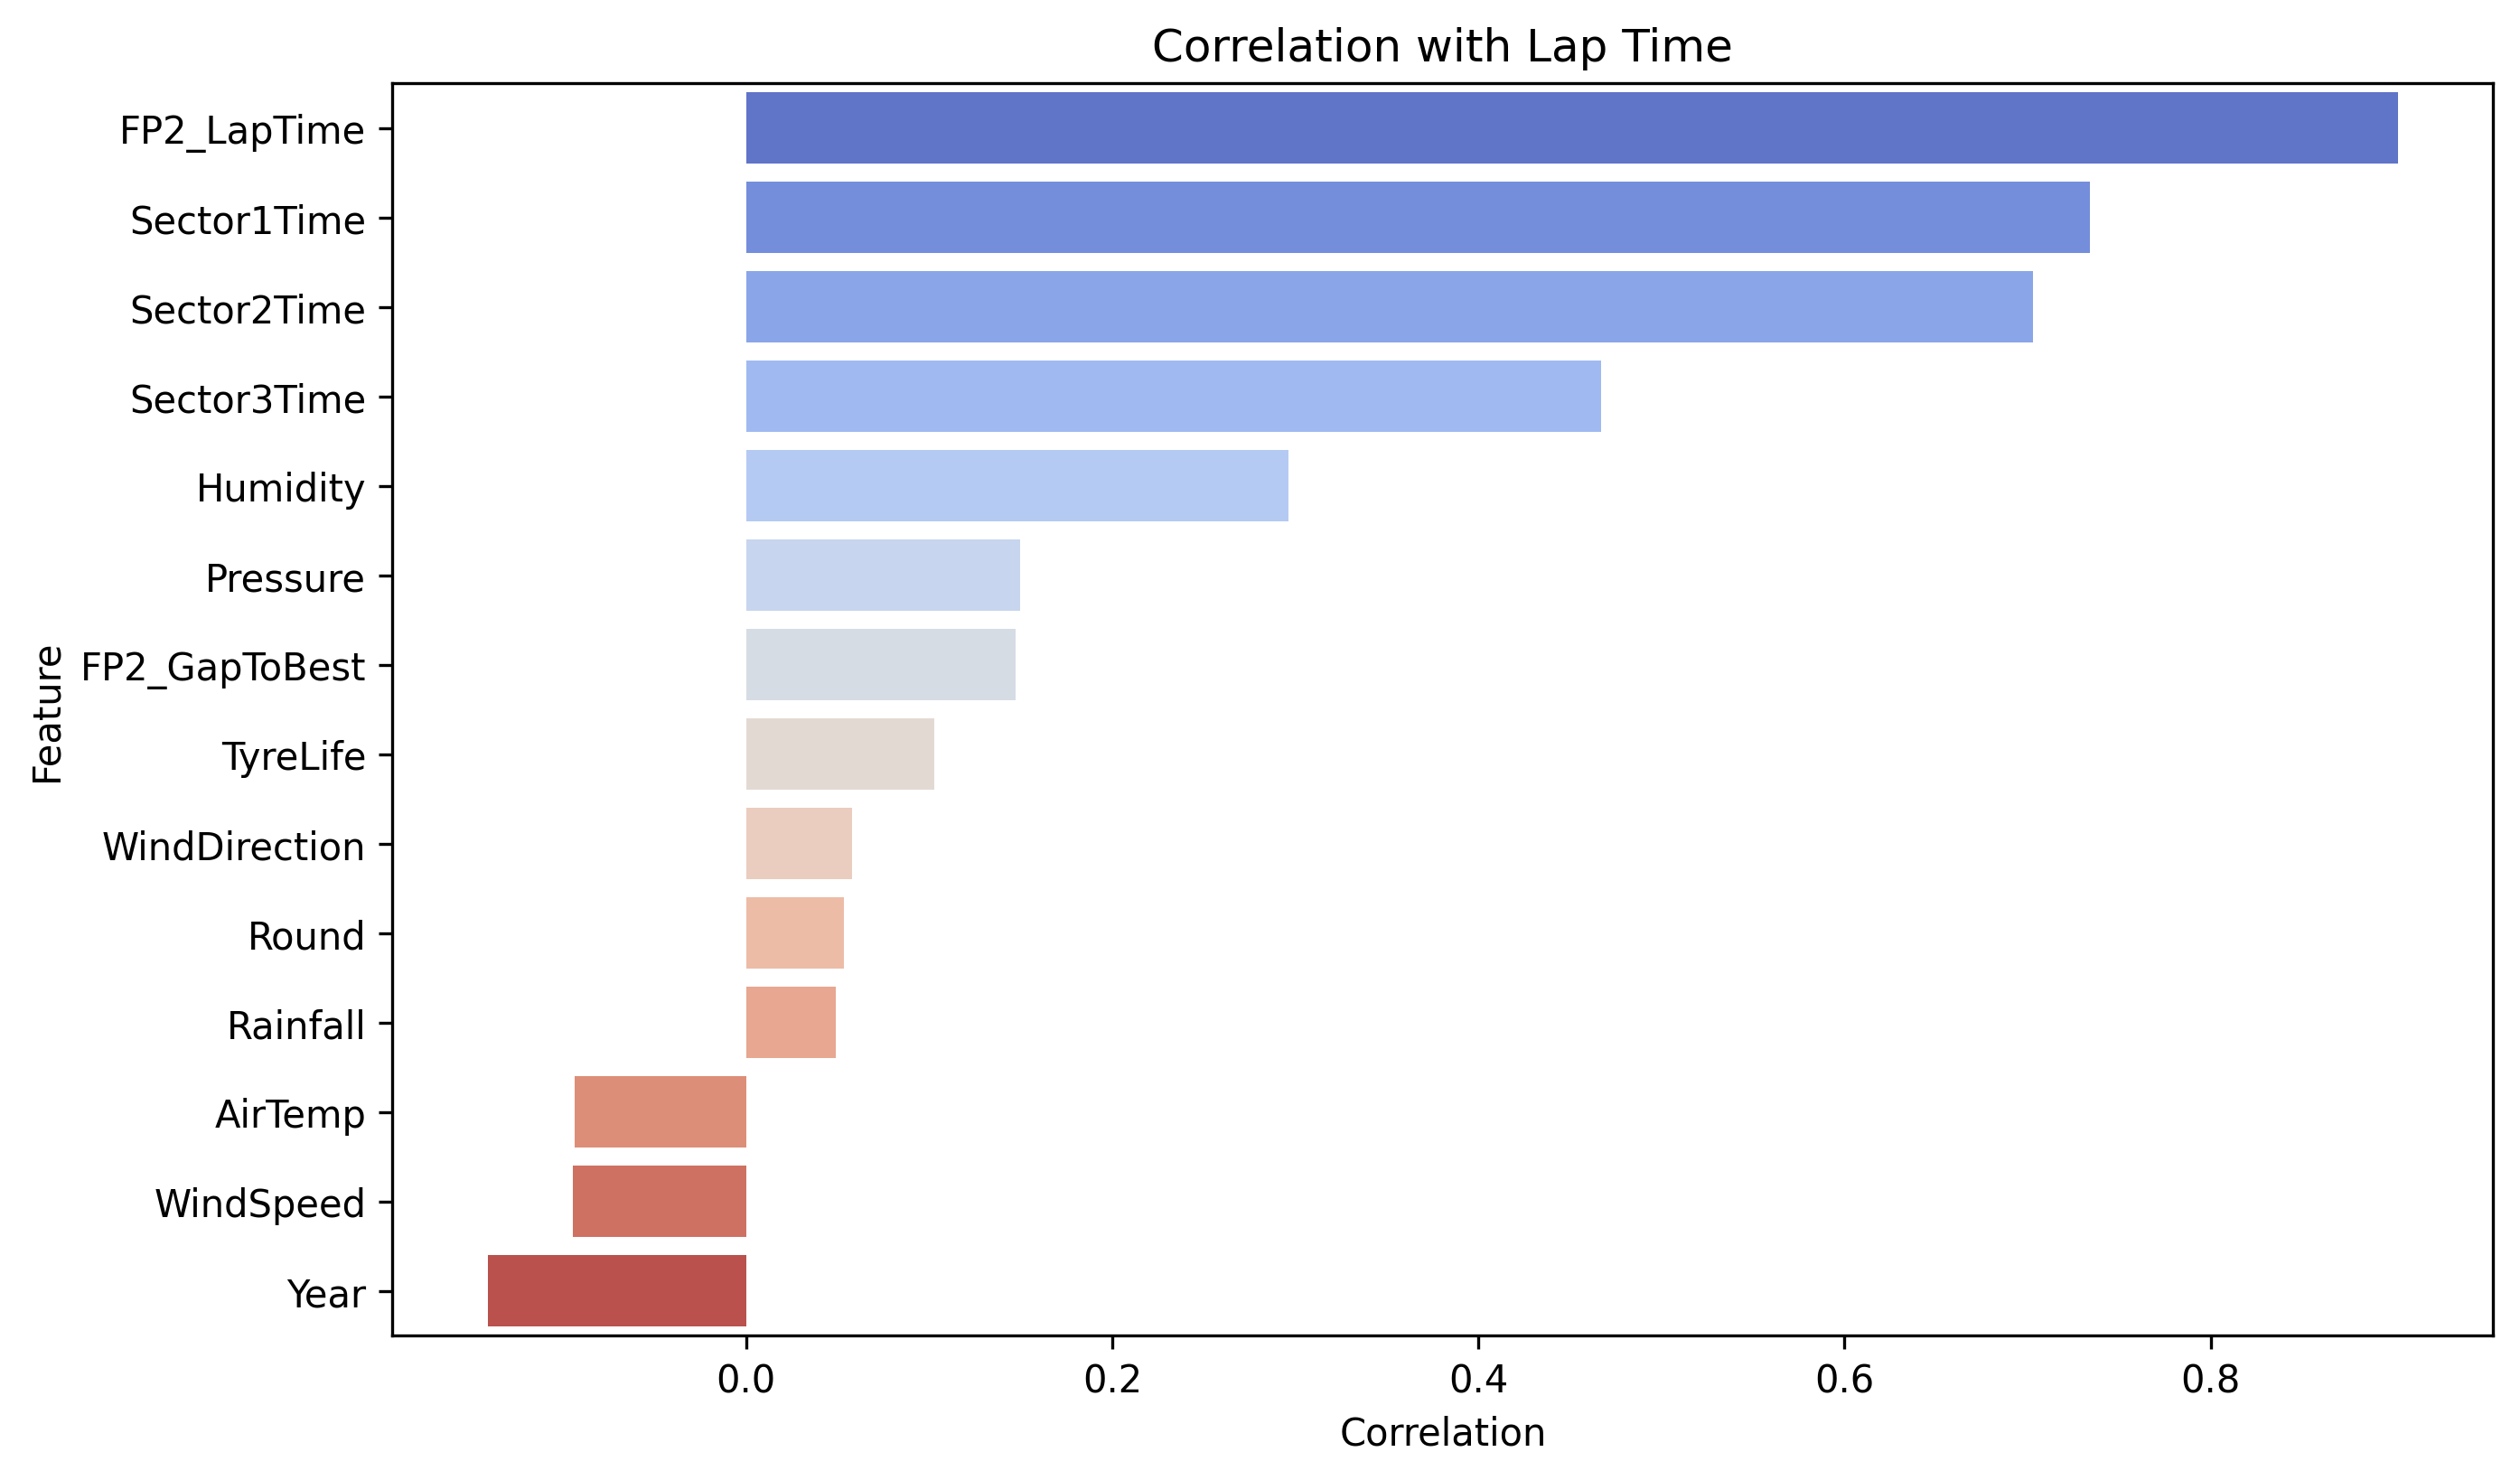
The model used the FP2 lap times, sector times, weather, and tyre-related data as key predictors. Among these, FP2 performance showed the strongest correlation with qualifying pace, whcih is expected due to similar track and ambient conditions between FP2 and qualifying sessions. In general, the model performed well across different race weekends, though occasional deviations (as seen in the Spanish and Miami GP 2025) suggest external factors like driver error, setup changes, or unusual session events may affect prediction accuracy.
Limitations and Future Work
While the model provides a reasonable estimate of qualifying lap times, several limitations hinder its ability to capture the fine margings in Qualifying sessions:
1. Fine Margin Prediction
The model struggles to accurately predict small lap time gaps (~0.1s), which are crucial for determining grid positions. In tightly contested qualifying sessions, even a slight error can misplace drivers by multiple spots.
2. Limited Feature Context
The current feature set lacks session-specific signals such as FP3 performance, track evolution, and driver consistency trends. Including these can improve the model’s sensitivity to real-time conditions and subtle performance differences.
3. Ranking Accuracy Over Raw Time
Since qualifying is about relative pace, improving the model’s ability to rank drivers correctly is essential. Enhanced feature engineering — including tire wear trends or driver form across sessions — can better reflect the competitive order.