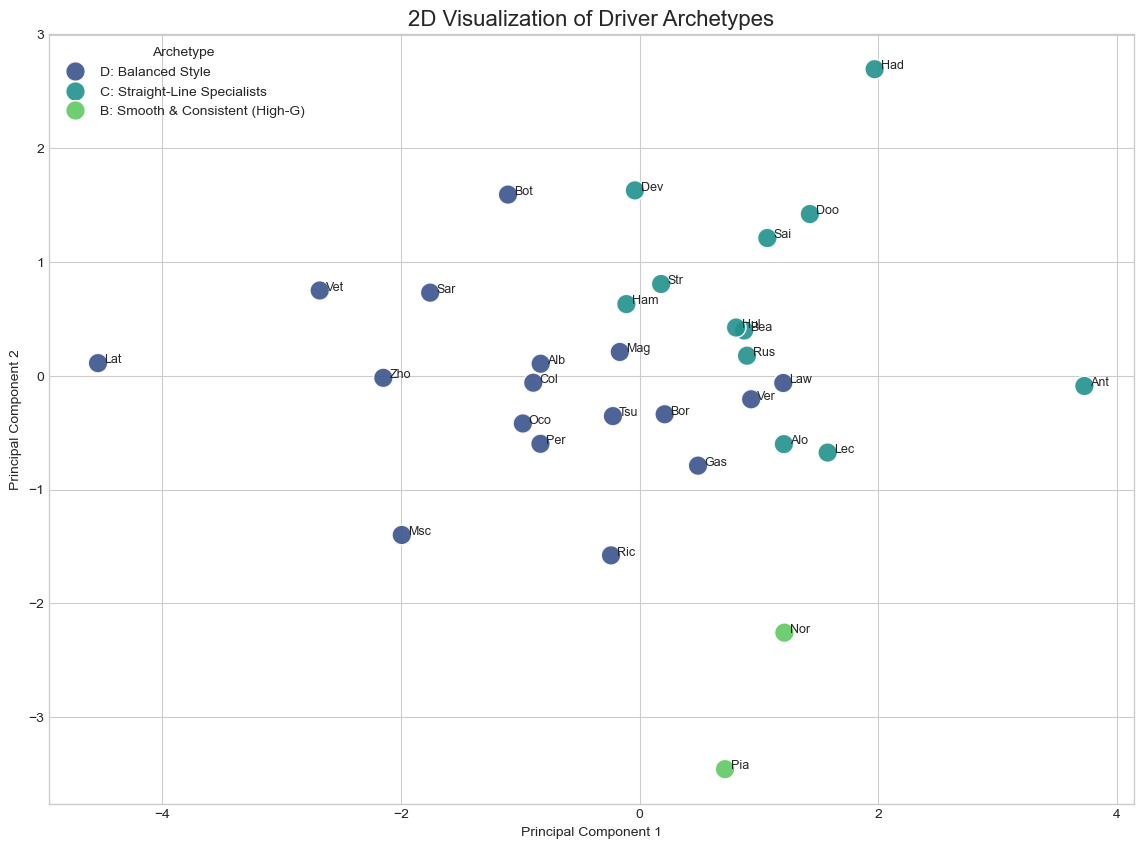
The first phase of our project was dedicated to answering the most fundamental questions: What are the distinct archetypes of racetracks on the calendar, and who are the drivers that fit into different stylistic profiles? To achieve this, we needed to transform the raw, high-frequency telemetry data containing thousands of data points per lap into a simple, comparable format.
We can see in the above plot that the rookies and new drivers are classified into "Straight-Line Specialists" while the more experienced drivers fall in the "Balanced Style". Norris and Piastri, who currently have the best cars on the grid are in one cluster - "Smooth and Consistent". This is in line with what we see in the actual sport today.
Feature Engineering: Creating a "Performance Fingerprint"
The core of this phase was feature engineering. We aggregated the complex time-series data for each individual lap into a single, fixed-length vector of Key Performance Indicators (KPIs). This process creates a concise "performance fingerprint" that represents the essence of that lap. The key KPIs we engineered include:
- Power & Aggression Metrics: These quantify how a driver utilizes the car's powertrain and brakes.
Throttle_Full_Pct: The percentage of the lap spent at 100% throttle.Braking_Intensity: The peak negative G-force achieved during braking zones.RPM_Avg & RPM_Std_Dev: The mean and standard deviation of engine RPM, indicating usage patterns.
- Cornering & Handling Metrics: These describe how the car and driver behave through corners.
Total_G_Mean: The average combined longitudinal and lateral G-force, showing how consistently the driver operates at the limit of adhesion.
- Strategy Metrics: These capture elements related to on-track strategy.
DRS_Uptime_Pct: The percentage of the lap where the Drag Reduction System was active.Gear_Changes_per_Lap: The total number of gear shifts, often indicating how "busy" a track is.
Algorithms: Discovering the Archetypes
With a KPI matrix established for all laps, we employed a two-stage unsupervised learning pipeline to discover the hidden patterns:
-
Principal Component Analysis (PCA): To handle the complexity of our many KPIs (which are often correlated), we first applied PCA. This technique distilled our features into a few, more meaningful "axes of performance." For example, it might combine throttle, DRS, and RPM metrics into a single "Straight-Line Performance" component. This crucial step reduces noise and makes the subsequent clustering far more robust and interpretable.
-
K-Means Clustering: Using the simplified principal component scores, we then applied the K-Means algorithm. We ran this process twice:
- For Drivers: By averaging the KPIs for each unique driver over the season, we clustered the drivers. This revealed distinct stylistic profiles, such as "Aggressive Brakers" and "Smooth & Consistent Operators."
The outcome of Phase 1 was a foundational, high-level understanding of our dataset. We successfully transformed millions of raw data points into a clear, quantitative classification of both the circuits and the competitors, setting the stage for the more granular event analysis in Phase 2.